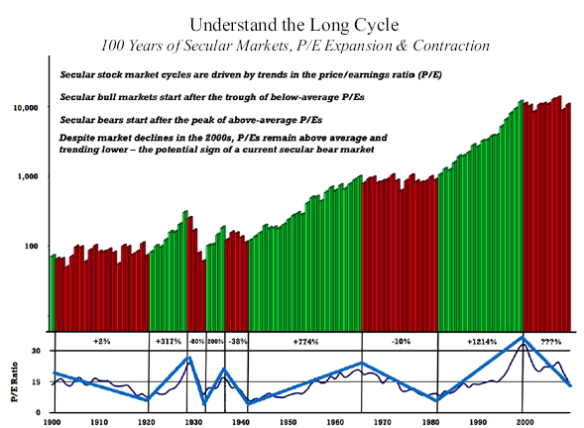
Chart: Secular Bear Markets Since 1900

Secular Bear Markets (red) since 1900. Source: Crestmont Research

Secular Bear Markets (red) since 1900. Source: Crestmont Research

I like this chart, but I would change one thing: the bear that started in 1929 could extend clear through to 1948 due to inflation and multiple compression.

Inflation (regular CPI) has reached double digits in the final years of each of the last secular bears. It was inflation that made the 1910s and 1970s markets into bears, since the nominal Dow was trending sideways.

Previous secular bear markets haven’t ended until PEs are compressed to near 10. Right now the S&P 500 trailing PE is near 15, with the Shiller PE over 23.


Hussman: Market risk is extreme

John Hussman is the rare mutual fund manager who uses technicals and hedging to minimize risk and maximize returns during a full bull-bear cycle. He hedged up in 2000 and 2007 to preserve his fund’s equity during the ensuing bear markets, and is again tightly-hedged in preparation for another downturn.

His weekly market comment is a must-read (if you just read this and Mish’s blog regularly, you’re all set). He uses a set of indicators to identify periods during which risk is elevated based on historical statistical analysis. They are: 1) stock market investor sentiment, 2) Case-Shiller PE ratio, 3) Treasury yield trends, and 4) price action (to indicate whether stocks are overbought or oversold using moving averages).

He concludes each market comment (in which he puts on his academic cap to discuss market statistics, Fed policy, etc in geeky detail), with a quick summary of where his funds are positioned according to the prevailing risk profile. When he starts his conclusion like this, you better not be long stocks:

Market Climate

As of last week, the Market Climate for equities was characterized by an unusually extreme profile of overvalued, overbought, overbullish, rising-yield conditions. Both Strategic Growth and Strategic International Equity remain tightly hedged here.

Here is a chart showing where these market conditions have existed in the past:

Prechter interview: Fed may be ended within his lifetime.

From Yahoo! Tech Ticker last week. Lots of market talk, then Prechter makes the case for truly free banking, in which banks could decide for themselves what to use as money. He beleives that most banks and savers would chose gold, as they have for most of human history. The first segment below is mostly on the markets — the comments on the Fed are in the second:

EDIT: Sorry, I didn’t realize that there are actually two segments to this interview. The comments on the Fed are in the second half:

At the end, Prechter makes a key point about the gold standard: it is not a free-market solution, because it is a “standard” set by the government. Essentially, a gold standard is redeemable paper money, but as we saw in the early years of the Federal Reserve (and actually in older times with many other central banks), the exchange rate between paper and specie is set by the government. Paper money remains legal tender and the primary unit of account, so citizens are forced to use it and the banking cartel can still inflate.

A much better solution is no standard at all. Under such systems, the unit of account was typically a weight of gold or silver. Hence the British pound sterling, which was exactly that (sterling is 92.5% pure silver). Under these systems, there were safe banks that earned money by simply storing metal and clearing payments. Interest was low, but inflation was lower or negative, since the growth of human productivity from improved infrastructure and technology meant that goods and services became more abundant over time, while the money supply grew only as fast as new gold was mined.

This is why the price level fell steadily during the 1870s in the US while the economy grew at its fastest pace in history, and why the price of a postage stamp in England remained the same for 100 years, even as the country grew rich. There were booms and busts and banks failed, but because even big ones were allowed to fail, bubbles remained contained and the busts freed up capital for productive uses.

Such periods will come again. This is not the end of civilization, just the end of a long credit inflation.

That should do it for today.

Just put the hedges back on. Wouldn’t mind going long from these levels, even.

Source: prophet.net

But boy, hard selling across the board: stocks, metals, oil, currencies — nothing is excempt. But hurray for the grains, which have held steady. When risk appetite comes back, they should benefit.

You know what? We might be doing a megaphone pattern here — big ramp up tomorrow if that is the case. It would all be an interesting, wide-ranging correction before we continue down, and down we are going: I wouldn’t be surprised to see SPX 700 by summer, 800 by April.

Some thoughts on the bear market.

This post started as an email that got way too long. I added some charts and put it up here:

The rally has not surprised me (on March 31 I expressed the opinion that we would hit 900 or higher by summer:

…more likely in my mind is a protracted rally extending to 900 or higher by summer, then rolling over to meet a date with 400 next winter. Look at last year’s rallies from March to May and July to August for an idea of what this might look like, though on a larger percentage and time scale because we are correcting a larger sell-off. The case for such a move is bolstered when you hear major investment banks’ strategists calling this a dead cat bounce. Too many people are still afraid to call a bottom, and they need to be suckered into long positions before this is over (along the same lines, too many traders are embracing the dead cat bounce and need to be shaken out before it can get back to leading the buy-and-holders to slaughter).

That said, I was leaning closer towards 900 than 1050:

I am highly skeptical, though respectful, of calls for a the mother of all bear market rallies. Robert Prechter and some other Elliott Wavers, as well as Tim Knight (slopeofhope.com) seem to be anticipating a 6-month or longer rally to as high as 1050. I simply don’t see why that is necessary in this environment. This is a depression, and the last one was accompanied by bear market that, after the first 6 months, maintained the momentum of a cruising supertanker. Rallies of 20 percent and 2 months were about all you got from April 1930 to July 1932 as the Dow dropped from about 295 to 41. That deflation-driven event was a much more orderly bear market than the jagged trajectory of the dot-com crash, which occured while the credit bubble continued to expand. Interestingly, the 1966-1982 secular bear (a brutal 75% loss in real terms) also traced out such a series of steep plunges and rallies as the bubble kept inflating thanks to a compliant Fed and the abandonment of the last trace of the gold standard. Employment was down, but animal spirits were still running high with the computing boom, the advent of securitization, and new innovations in consumer credit.

Though I saw this rally coming a mile away, I have traded it very poorly. First, I put too much emphasis on picking the absolute bottom for a buy-in.  Back in Feb and March I got out of most of my shorts by the time we were under 700, and I entered a bunch of limit orders to put over 1/2 of my net worth in SPY on the long side. Unfortunately, those orders started at 620, and we bottomed at 666. So I missed the bounce, and not only that, starting in April I began to short the junk stocks that were flying the highest and have been the real driver of this market. That was way too soon, and they kept on going, to the surprise of many a long-short fund as well. The outperformance of junk was a surprise, but the overall bounce has not been. When you have mood as compressed as it was back in March and you reach an exhaustion point after 18 months of a strong bear trend, you get a big reversal, which can then generate the extremes of optimism needed to set up the next plunge.

I’ve been buying long-term puts on the S&P and Nasdaq again since late March (way too soon, considering that I expected the rally to continue). I bought a bunch more yesterday, by the way. I view it as extremely unlikely that this market doesn’t decline to the point where solid value offers support — that would be a sub-10 PE and dividend yield of over 5% on dividends that have to fall by 50% or more from here to around $12 for the S&P. That would be the 240 level, but it should take at least a couple more years to get there (or below), if not four or five.

What has always worried me as a short in this market is not a 5-8 month rally, but a 12-18 month affair  like some of those that Japan has experienced in its long bear market since 1989:

Source: Yahoo! finance

That said, Japan’s financial sector was deflating while exports were improving, families had savings and the rest of the world was growing. Today’s situation is much, much more severe of course, and we can only find a parallel in the Great Depression for so many of the economic trends we are seeing. The longest bounce in that bear market was 5 months, and it was of similar magnitude (48% from Nov. ’29 to April ’30; we’re up 47% in the 4.5 months since March 6).

This is the Dow from 1928 to 1931:
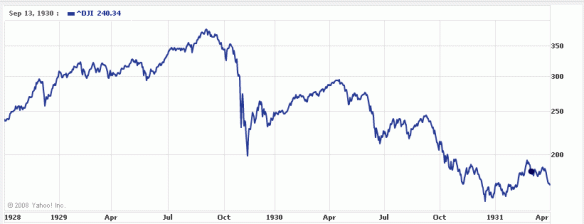
Source: Yahoo! finance

And here’s how that bounce looked from 1933:

Source: Yahoo! finance

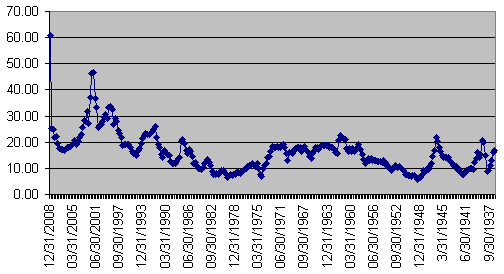
The S&P500 is now the most overvalued in history by PE (infinite as of this quarter’s running 12 month total, or a dot-com-esque 32 times current annualized earnings levels, about $7.50 per quarter). The dividend yield is about 2.5%, but dividends are nearly as high as earnings right now, which is completely unsustainable (they should be less than half of earnings). On a sustainable basis, the yield is 1.0 – 1.25%.

Here is the S&P PE ratio (TTM data through 12.31.08) going back to 1936. (the dates read right to left, since I can’t figure out how to reverse them in Excel). Data through 6.30.09 would be off the chart:
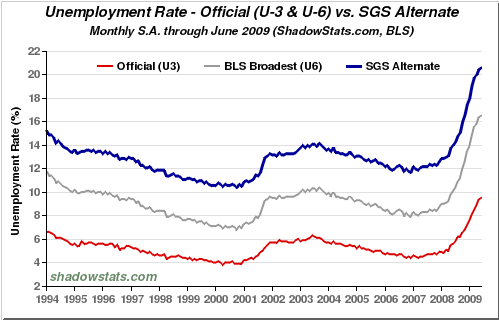
Real (U-6) unemployment is approaching 17% and climbing, and that is if you exclude the likely 6 million illegal immigrants who are out of work now (who used to take home $100 per day as construction cleanup boys or dishwashers). Throw them in, as we would have in the 1930s, and you get a solidly depressionary 20%.

Credit is still being withdrawn everywhere you look, whether in home equity, credit cards or small business loans. There has been a bounce in the corporate bond market, but that is due to the same technical forces that are driving the stock market, and the big bankruptcies are just beginning. Only the very weakest have gone under so far, like the car companies.

So with this backdrop, I don’t expect this summer’s good feelings to last into the holidays. The markets should start to roll over again soon, since the big-money value investors needed for a sustained advance can find no reason to buy in, and the little guy has been burned too many times to chase this market very far. Volume is very thin, and an unusually large fraction of trading is taking place between automated programs.

When the data to back up the green shoots theory fails to show up after another few weeks or months, and even official unemployment is solidly into the double digits and climbing, while another huge wave of mortgage resets hits the middle class, there will be no hope at all left to support this market, and it will slide to levels not seen since George Bush Sr. was in office.

It will then still not be a safe long-term buy. For that, considering all of the obstacles that the government has created to profit-making, we need to get back to Reagan-era levels, somewhere under the bottom of the 1987 crash.

S&P500:

Source: Google finance

‘Defensive stocks’ is an oxymoron.

If you don’t like stocks, why own any of them? Sure, you would be ahead if you had switched from Crox to Merck last fall, but Merck has still been cut in half in the last 12 months. Even Wal-Mart, Costco, Monsanto, Toyota and Honda have been among my better shorts this fall. In a bear market, earnings and multiples contract for all companies, not just the high fliers.

JP Morgan just came out with a list of 16 stocks to hold in a two-year “global recession,” which seems to be the new euphemism for depression. From Bloomberg:

The list merges the strongest convictions of its 78 stock analysts with a “top-down” view that the banking crisis threatens global growth, Thomas J. Lee, chief U.S. equity strategist at the New York-based bank, said in a telephone interview.

“There is growing demand from clients for core holdings that outperform in a global recession,” Lee said. “Every week that passes that credit markets remain challenged, there’s incremental damage to the macro economy.”

The companies are:

3M Co.
Baxter International Inc.
Colgate-Palmolive Co.
CA Inc.
Devon Energy Corp.
General Mills Inc.
Gilead Sciences Inc.
Google Inc.
Hewlett-Packard Co.
McDonald's Corp.
Merck & Co.
Monsanto Co.
Nucor Corp.
Philip Morris International Inc.
Union Pacific Corp.
Visa Inc

I have created a Yahoo! Finance portfolio of these companies, and I am going to track their performance over the coming months and years. I give them extremely low odds of outperforming a 2-year Treasury bond, and about even odds of beating the Dow. To be more specific, I bet they fall by an average of 50% over the next 24 months, even from today’s prices, which are about 25% lower than 2 months ago.

Disclosure: I happen to be long Union Pacific puts, and I recently sold my Nucor and Monsanto puts.

Stocks are very expensive. Mr. Market is still in denial.

Bottom line: Declines in earnings and mood could result in an 80% drop in stock prices from here.

The S&P 500 is still priced at over 15 times last year’s earnings ($66 as reported*). Since the late ’90s, corporate earnings have been as inflated as the rest of the economy by cheap credit. From 2003, they spiked up even further, way out of line with long-term trends, largely due to inflated financial profits from the real estate scam and consumer-related and other income from society-wide profligacy. Here’s a 20-year chart:

Click image for larger view. Source: Techfarm

Mean reversion

To make matters worse, in the optimism of the bubble environment, investors extrapolated the recent pace of earnings growth out into the distant future, completely forgetting that growth is mean-reverting. This long-term mean in the US has been about 6% (good luck keeping that up under socialism). Earnings growth will always revert to a mean in a market economy simply because excess earnings attract competition. In an economy with government-supported fractional reserve lending, the downside of the credit cycle will also undercut earnings (and generate large losses).

2006 S&P 500 earnings of $81.51 were an extreme historical anomaly, so applying a 19-handle to them was insanity. If Mr. Market hadn’t been so hopped up on the energy drinks popular at the time, he would have thought long and hard before paying more than $8 for 2006 earnings, especially because stocks were hardly paying any dividends at all.

The first two quarters of 2008 came in with $15.54 and $13.17 in earnings, respectively. If you assume that each of the remaining quarters will be worse than the last by $2 (pretty optimistic if you ask me), you come up with a final 2008 figure of $49.

Mood swings

When thinking about what to pay for those earnings, you want to think about what kind of mood Mr. Market will be in next year. Somehow, I don’t think he’ll be quite as optimistic as of late, since the aftermath of that tuarine/caffeine cocktail can be a downer. After such a frenzy, his mood typically declines for years and doesn’t turn up again until he has put a sub-10 multiple on recession year earnings.

Looking at past episodes, the odds are strong that Mr. Market pays less than $12 for each dollar of 2008 earnings by the end of 2009: an index value of 588 using our ’08 estimate.

But then 2009 earnings aren’t looking so rosy either: even sell-side analysts are predicting that they will be lower than this year’s. Extrapolating a decline of $1 per quarter from our $9.17 estimate for Q4 ’08, you get $27 per the index for 2009. This happens to be about what the 500 earned in the mild recessionary year of 2002. Think next year will be worse? Adjust accordingly.

Whatever your own ’09 estimate, keep in mind that Mr. Market will be downright angry with stocks’ performance and extremely cynical by the time 2010 rolls around. If history is any guide, by the end of 2010 he might not even pay $8 for those earnings. That would be an S&P 500 value just north of 200.

Got LEAPs puts? You can bet on earnings and Mr. Market’s mood out to December 2010 with options on SPY.**

*S&P provides a big Excel spreadsheet of such figures here (download).

**See disclaimer. I own a ton of these.

The Dow:Gold ratio broke 9 today.

It just broke 10 yesterday. By the end of this bear market, one ounce of gold will buy the Dow, just as it did in 1932 and 1980. In the short-lived Panic of ’07, it only dropped to 2 ounces.

Gold is money, and in deflation, that’s what you want. I still think gold should fall to $600 or lower after this panic buying subsides and people need to sell it just to pay their bills and debts. Also, the reality of deflation hasn’t begun to set in yet — people are still looking in the rear-view mirror at inflation. A lot of gold bugs are going to bug out when their hyperinflation scenario doesn’t pan out soon. Their timing will be awful, because we will eventually (I’m talking years) get hard-core inflation after the new New Deal kicks in.

Still Threat Level Red, indicate TED spread and VIX.

Here’s the Treasury Eurodollar spread again (Bloomberg):

And here is the VIX (Yahoo! Finance):

It is rare, to say the least, to see these warnings lights stay on for more than a day or two, and these levels are unprecidented in the crisis.

To crash or not to crash?

Short-term timing is the hardest part of trading. Sometimes you are offered opportunities with a 90% certainty of a payout (such as an overextended multi-week rally in a bear market), and sometimes it is a complete toss-up. To preserve your batting average, it is essential to go neutral for your time horizon if you don’t have a high degree of certainty. You don’t have to swing every time.

It will be very interesting how the markets resolve over the next few business days after the bailout becomes law. I made the call for an historic bear market and depression more than a year ago, and things are playing out so far without surprises, other than the rapidity of the government’s reflation attempts (which have been fully expected and will only worsen matters). It was a simple matter to see that the credit bubble would burst and drag down asset prices. It is also plain as day that the US equity market’s fall is not even a third over in value or duration. What is uncertain is the timing of the rallies and mini-panics that will continue to comprise the bear market.

Last Friday I noted the freeze in the credit markets and said that a crash (in my mind, roughly a 20% loss in a few weeks, punctuated by days like this Monday) was highly probable. Even though the market let out a lot of steam on Monday, it might have built it back up on Tuesday.

A major crash from here would still not surprise me, but neither would a multi-week or even multi-month rally. I have detected a lot of bearishness lately from people who were slow to catch on to the situation, and this makes me wonder if we have seen our sell-off for now. The market, of course, does the opposite of what the majority expect. Maybe the majority thinks that there will be a big rally after the bailout, or maybe they have finally become sensibly cynical.

At any rate, I will be selling any rally and covering shorts in any plunge, because after a plunge always comes a rally, especially at this early stage of a bear market.