ES update (edited for clarity): stock futures still strong, but watch RSI for signs of weakness

We don’t really have waning strength yet on the hourly scale in SPX futures, but I can see the possibility. If this current rally leg (from Friday afternoon’s low around 1083) fails to break 1107 (Friday’s high) or does so on weaker RSI than the last rally, it will be a hint that the entire move up from 1036 is coming to an end. A fresh wave of selling will be even more probable if hourly RSI makes a lower low after a lower high.

Watch for weakening rallies and strengthening sell-offs to telegraph impending declines, even if prices are holding up (to be clear, we don’t have such weakening yet — I’m just watching for it). Prices often do stay elevated right up until a nasty break, like we saw from mid-April to early May (see chart below, ES 2-hour bar). You can also see the strengthening rallies and weakening declines since the bottom last week (the bottom was less strong than the preceding wave down, which is a classic buy signal).

Here’s the ES hourly. Still showing strength, but it would be bearish if this current wave does not get at least as powerful as the last.

And 15-min bar… this one shows weakness, but it’s too early in the wave to be sure.

All charts from TD Ameritrade

Today is a trading day for most of the world (and US futures are trading, though on a cut schedule), so don’t think that prices will wait for 9:30 EST Tuesday to make any important moves.

Remember, we have a rather neutral set of conditions on the daily chart, but the Elliott Wave crowd is looking for a hard third wave down anytime, and last week’s action could serve as a perfectly functional 2nd wave. If there is a third wave coming, it will be more powerful than the decline from 1220 to 1040, possibily taking us under 900 very quickly. Judging by May 6, the market has signaled that it is capable of such a move, and relentless declines are common following bear market rallies. Also in favor of such a move are the continued dollar and yen strength, anemic rallies of the euro, chf and pound, and the fact that the commodity complex is looking broken.

If you can’t tell, I am ambivalent about stocks now and positioned appropriately flat at the moment. These are not good junctures to trade, since the signals are so mixed.

Prechter in the morning (King World News interview)

Eric King is one of the best financial interviewers out there, so he gets the best guests of anyone I know.

Listen to the MP3 here, recorded last Saturday, March 20.

Take-aways:

The last of the bears are capitulating, just as the last of the bulls turned bearish last winter. Everybody loves stocks after a 73% rally, and there is huge psychological pressure to be bullish.

The market only gives away free money for so long (unbroken strings of up days often come near the end, as in Spring 1930).

The last two times that the market made a double top (July/Oct 2007 and the 2000 top), the Nasdaq surged at the very peak, leaving the Dow and SPX behind. SPX has just barely made a new high, but it feels like it’s much higher than in January.

GDP expansion is very weak compared to the stock rally, bank lending and jobs are still trending negative.

This is not a recession that has ended. This is a depression that has had a big countertrend rally.

States are all bankrupt, because they always spend too much. Governments always go bankrupt in the end. (Interesting factoid: Nebraska’s constitution outlaws borrowing by the state, so they are in the best shape).

All of the dollar-denominated IOUs are going to be worthless in the end. The government’s backstop has delayed this, but the debt will still go bad. The central banks will not take on all the bad debt, so the governments are trying, but they will ultimately default themselves.

Hyperinflation is not an option with all this debt. Default (deflation) is inevitable. Government defaults are deflationary.

Cycles are part of the human social experience. Muni defaults haven’t happened since the 1930s, but that is only because that was the last time we were at this point of the debt cycle. Munis will end up as wallpaper — no way the states can pay them off.

Conquer the Crash was released in 2002, but the stock market rose for 5 more years and the credit bubble got even crazier before finally topping in 2007, but the extra debt is just making things worse now that we’re at the point of no return.

We have a return of confidence. AAII (American Association of Individual Investors) survey shows about 25% bears, same as October 2007 and May 2008 tops. This is not a good buying opportunity.

Every investing group (individuals, pensions, mutual funds, etc) has been overinvested for 12 years. Mutual funds are only holding 3.5% cash. They have never given up on stocks, even in March 2009, which was nothing like in the 1970s and early 1980s.

Very few people think we can end up like Japan, and keep breaking to new lows for 20 years. Everybody always has a “story,” a narrative as to why the market is going to keep going down (at bottoms) and up (at tops).  (Story today, IMO: PPT manipulation and money printing will drive stocks up forever). The story is often exactly wrong at the top and bottom.

Interest rates do not drive stocks. Lower rates are not bullish (just look at the 1930s or 2007-2008). Rates went up from 2003 – 2007 as the market rallied. People’s logic is always incorrect at the turns. Nor do earnings drive prices: stocks fell 75-80% in real terms from 1966-1982 as earnings rose.

Oil and stocks have a correlation that comes and goes – sometimes none, sometimes very positive, sometimes very negative. No predictive power.

Markets have a natural ebb and flow that arises from herding processes in a social setting. Reasoning about causation is a waste of time.

Economists jabber on about all kinds of causation, but they never offer statistics that pass muster.

Bond funds are going to slaughter the masses. The public always buys the wrong thing at the wrong time, and a wave of defaults is coming.

The dollar is likely starting a major rally (up 9% since fall, 11% vs euro). Prechter was early on that call but it still was a good one. Might be the start of a renewed wave of deflationary pressures.

The message in the new edition of Conquer the Crash remains, “get safe.” Find a safe bank, hold T-bills or treasury-only mutual funds, cash notes, and some gold and silver. No downside to safety.

Smackdown

This would be a pretty good way for a 3rd wave decline to start:

Prophet.net

See how the 30-min RSI called both the ramp off Monday’s low and the turn down yesterday? We’ve got a nice channel line break, too, and RSI has plenty of room to run today.

After all that worrying, is that all the bounce we get?

This might have been as simple as an A-B-C countertrend rise to the 50% retracement of the Wed-Fri decline:

Prophet.net

For an across the board deflation-style sell-off that started with such powerful internals, it would be odd for the move down from January 19 to end with the 10-day average equity put:call ratio not even breaching the mean:

Indexindicators.com

Treasuries are well-bid and commodities are looking weak. Not much in the way of animal spirits today, though Greece enjoyed a little bounce from its extreme oversold condition. I’d consider buying a Greek ETF if there were one.

Some crystal clarity on the waves

Someone asked for clarification on where I think we are in the wave structure, so naturally I broke out my kiddie drawing program:

.

Seriously, it’s hard to get precise about labeling waves at anything but larger orders of magnitude. It’s more about the feel of the market (whether it is the probing ones and twos or a rushing three or a struggling four or an exhaustive five).

Anyway, the above drawing starts at the 2007 highs (B wave top) and ends where I think we are going in 2010. Primary 1 ended in March, primary 2 may have just ended in January, and we are now in a smaller degree first wave in primary 3. Since we’re barely 3 weeks in and are only down 6-7%, it’s likely that we are still working on minor wave 1, and within that wave probably in the 1-2 area. Minor 1 of primary 1 bottomed in March 2008 with the markets down 20% and Bear Stearns going under. This doesn’t feel anything like that yet. This is more like the early probes of February-March, July-August or October-November 2007. We’re so early in, the news guys don’t even feel the need to come up with explanatory narrative yet.

Because this is primary 3 already, don’t expect the market to be as generous with shorting opportunities as in the drawn-out, rounded top of 2007. I expect minor 1 alone to do some serious damage, certainly get down under 9000 on the Dow.

Weekend charts

When the short-term gets hazy, remember the big picture.

The drop so far (about 6% in 12 days on a closing basis, 9% in 13 days intraday):
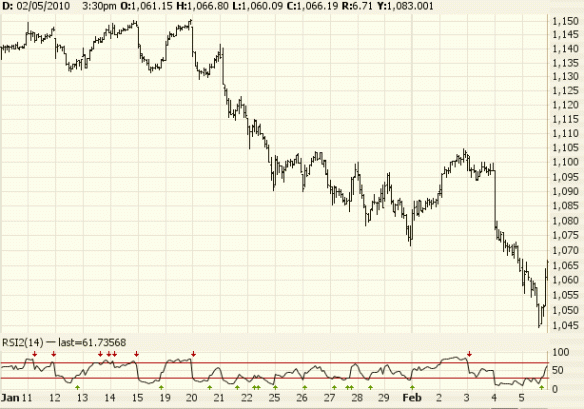
Source: Prophet.net

Here are the conditions I am watching: RSI on the daily scale is now oversold. However, DSI bullishness has dropped from near 90% to the 30s, which still leaves a little room on the downside for a first wave down from a big bull move (these sell-offs often end with about 20% bulls). Put:call is still very low for the bottom of a sell-off of this intensity. The VIX also has room to run, since it has still not cracked 30.

The deeply oversold hourly RSI, the swiftness Friday afternoon’s 2% snap, and the daily reversal bar (new low, then a close above the previous close) suggest that a countertrend rally has just kicked off, but if that is the case, it is from somewhat more subdued conditions than often mark the end of sell-offs of this type (a sudden drop after a long, smooth trend upward on great complacency). If this were 2009, the market would respect the current oversold condition, hold and then rally, but the Great Bounce is over, and the character of the market has changed. Although it feels like we’ve already filled our panic quota, the put:call ratio, VIX and DSI leave open the possibility of a very sharp (3-6%) intraday drop early this week from which the market would recover quickly and rally for several days or weeks.

Another possibility, and I somewhat favor this one, is that the rally from Friday’s lows is meaningful, but will not retrace as much of the decline as rallies from bottoms with more signs of panic. In this case, I’d be looking for a top no higher than 1100 on the S&P.

This is a tricky juncture to trade, since there is no near-term expectation of anything but volatility. I would not want to be levered short nor long here. A trader could go long against Friday’s lows for a quick trade, or stay short while ready to absorb a 5% or even 10% rally. Traders with modest, unlevered short positions (not inverse ETFs) can relax and just check the market each evening and not worry about the chop or even a big retracement. The real money is made in the sitting, as Livermore said. 50 points is not worth getting shaken out of 500.

Deflation has been here all along; the markets just pretended otherwise.

I sure wish I’d sat tight on all of my (levered) shorts from January: stocks, sugar, cocoa, oil, copper, platinum, palladium, silver, euro, Swiss franc, New Zealand dollar, South African Rand. ALL of these have fallen heavily. I captured 1/4 – 3/4 of their respective drops, so it has been a great three weeks, but I would have been served so much better by just letting everything run than attempting to finesse positions. This across the board selling, with strength in the dollar, yen and Treasury bonds is the same old deflation trade that pummelled everyone but shorts in 2008.

I view 2008 as a warm-up, a down payment on what is coming in 2010 and beyond. The recovery of 2009 is a fraud, and it will be seen clearly as such a year from now. Obama, Bernanke and Geithner will be thrown to the wolves, and politics will start to get more interesting, with all kinds of radical ideas gaining traction with the public, few of them sensible.

To help prop up the government another war could be started, since the neocons (who never left power but just use a “D” puppet now) would like to destroy more of the middle east. Ugly, ugly stuff, but all too familiar… how does that song go, “all my life, panic in America”?

Ok, let’s look at some charts:

Here is the 5-day average equity put:call ratio. I’m still looking at the summer 2007 period for clues. Remember the flickers of early panic that August, like Cramer’s tantrum? (By the way, my money says that was staged to get public support for inflationary Fed actions at a time when everyone was worried about inflation.)
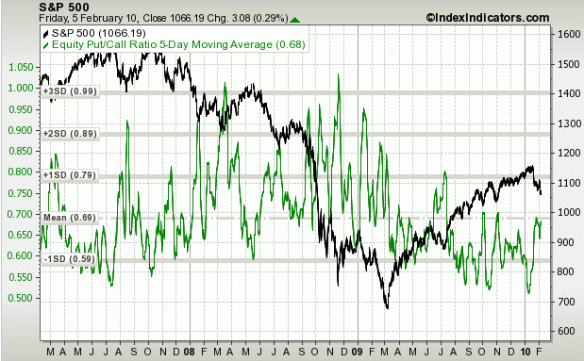
Indexindicators.com

You can see that we’ve still only reached the mean on this powerful fear gauge. It sure feels like panic out there, but only becuase of how serene things have been lately, just like in spring 2007, the Goldilocks era.

Here’s a daily chart of the last 8 months (I’m also eyeing last summer’s dip for hints, since it was a deflation scare and major sell-off that may offer clues as to some of the dynamics at play):
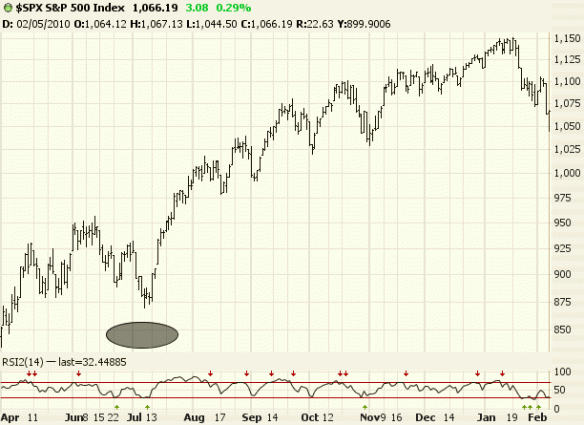
Prophet.net

Here are some more snapshots of tops, starting with the 2007-2008 b-wave top (the a-wave was 2000-2003, and c is underway — this is Prechter’s labeling, which considers 2000 the start of the bear):
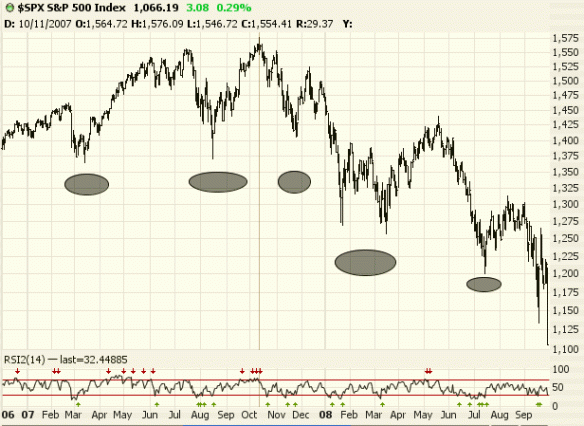
If this move is like the initial drops at the b-wave top, it is mostly over and will be followed by a rally that retraces most if not all of the way back up. There is a difference, though — that was a cycle wave top, and while market complacency has been extreme lately, social mood is nothing like 2007, and the economy is in the toilet. This is the most overvalued market in history (including ’99-’00), and more importantly, it has already taken a wrecking ball to the 2002-2005 technical support. As we saw in the spring of 1930, third waves can move very swiftly through the territory of second waves. Actually, this whole cycle wave c is a third wave on a larger scale, and it only took 12 months to retrace the entire 4.5 year rally from spring 2003. The start of a smaller scale 3rd wave can been seen above in the decline from the May 2008 peak: unrelenting. (Much of this labeling of higher degree waves has emerged as a kind of consensus among wavers, including Prechter’s EWI, MishDaneric and Mole.)

Here is the top of the bear market rally that lasted from Nov 1929 –  April 1930:
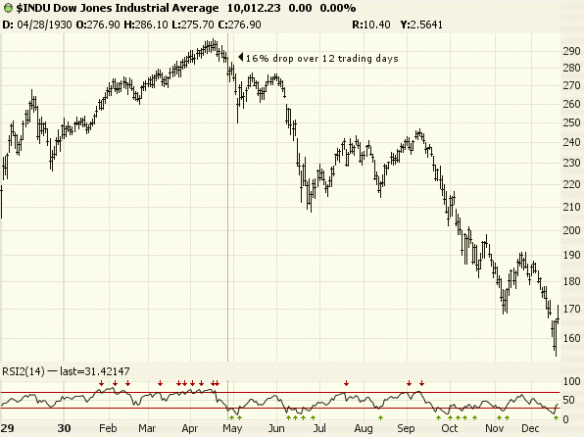
That drop started off with more intensity than this one, as the Dow has fallen just 8.3% intraday in 13 trading days, compared to 16% in 12 days. It is of course possible that we catch up very quickly with a minor crash, akin to the gap down and 6.4% intraday drop on May 5th 1930. Prior to that the market was down 11% intraday. Note how the market crashed from allready oversold conditions, as it usually does. Such a washout also happened on August 16, 2007. A 5% intraday loss this Monday or Tuesday would be one way to resolve the still mild VIX, put:call and DSI readings. If such a crash does occur, it would be a good time to buy in anticipation of a very sharp snap-back. It is probably too early for a sustained crash (Oct ’29, Oct ’87, Oct ’08), but of course in ’87 the market went from oversold to very oversold to the greatest intraday drop of all time. It did not, however, do that right from the top without putting in a first and second wave:
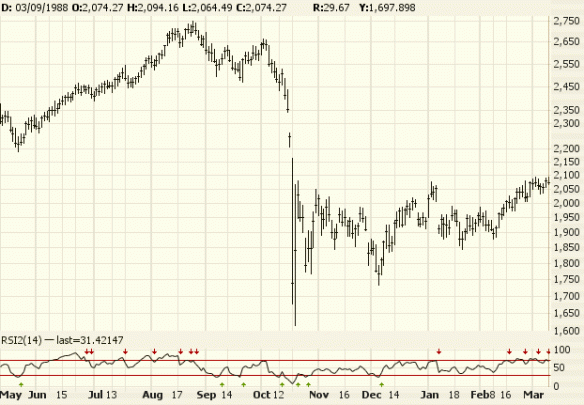
Now that’s why you need stop-losses (and another reason why futures are best since you get stopped out overnight and not at the open by which time the market could be down 8%).

One more big top for your consideration, 1937: the first wave down was composed of a series of ones and twos — 5% declines, 3% gains, rinsed and repeated:
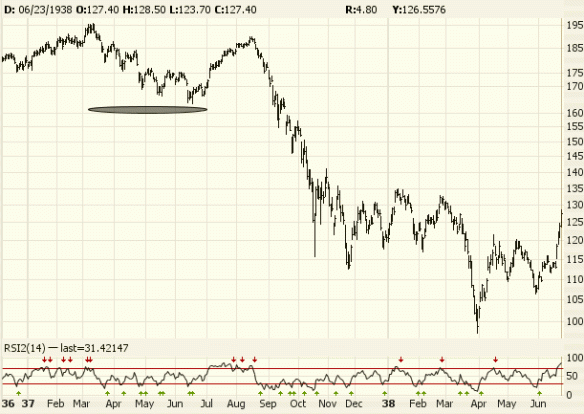
(That’s right, the market crashed again after FDR’s policies hamstrung the economy and pushed the US deeper into the depresssion. The market fell lower still in 1942 as the war and inflation crushed private enterprise.)

I’m also keeping an eye on the finacials and REITs, which would both look better if they dropped a bit more before a bounce. There just isn’t that much so far to react against. The financials (XLF):
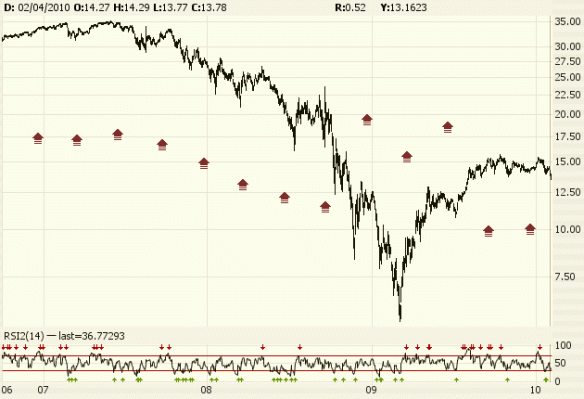
The REITs (IYR):

I don’t see much panic at all in these groups, though they are clearly rolling over. They could stall for a while, but It is hard to see a big bounce here, and without the financial sector the rest of the market isn’t going to get far.

In sum, my best guess is that this will play out like either (1) July-August 2007: chop for the next week or two — big swings, maybe a new low — then some kind of rally for 2-6 weeks (though I don’t think we’ll get a new high — my target would be 1075-1115); or (2) May-June 2008, with a steady drift down. But for 2010, it’s just down, down, down.

Ending diagonal

This is the last 5 days of the S&P 500:

Source: Prophet.net

From Elliottwave.com:

Ending Diagonal

An ending diagonal is a special type of wave that occurs primarily in the fifth wave position at times when the preceding move has gone “too far too fast,” as Elliott put it. A very small percentage of ending diagonals appear in the C wave position of A-B- C formations. In double or triple threes (see next section), they appear only as the final “C” wave. In all cases, they are found at the termination points of larger patterns, indicating exhaustion of the larger movement.

Ending diagonals take a wedge shape within two converging lines, with each subwave, including waves 1, 3 and 5, subdividing into a “three,” which is otherwise a corrective wave phenomenon. The ending diagonal is illustrated in Figures 8 and 9 and shown in its typical position in larger impulse waves.