VIX & Put:Call starting to make puts attractive again

A fair degree of complacency has snuck back into markets over the last month.  We don’t have a strong sell signal in stocks yet, but if April marked the high in US and European markets and economic indicators are turning down again, this could be a good spot to start building short positions again:

Here’s the equity put:call vs the 20 day moving average, back to one standard deviation under its mean. Dipping lower would require the kind of extreme complacency that we’ve only seen twice in the last decade, so I wouldn’t count on it:

The dollar has also corrected its overbought condition (and is actually very oversold), which is key for a resumption of the deflation trade:

Week in review and intermediate-term thoughts

Today I’m going to lay out what I’m watching for clues about the intermediate-term prospects. The action of the last 4 weeks has been more suggestive of a reversal than any we’ve had since the March 2009 lows. However, even if a top is in hand and we are finally at our spring 1930 moment, I’m not willing to throw caution to the wind and discount the possibility of another few weeks of rally.

Let’s start with the 5-day average equity:put call ratio, which has nailed so many intermediate-term tops, not least of which this last, which it suggested would be followed by a serious decline:

Indexindicators.com

The put:call ratio could use a bit more of a reset, which could be achieved by just a few more days of calmer or rising markets. Nothing major required here, just a pause.

This break has shaken up a few traders, but judging from interviews this week, the majority remain fairly sanguine about a continued bull phase and consider this a healthy correction, much as they did the first declines off SPX 1550 in late 2007 and early 2008. Also, the past year has established a very clear pattern of modest declines followed by new highs on extreme bullishness. Traders and their machines may be programmed to buy this dip, but with the recent technical damage (we busted the last low for the first time in the whole rally and experienced a mini-crash) I’d expect any rally to be relatively shallow.

There is a pattern of reduced oomph on each subsequent rally phase, which you can see in the diminishing slopes of each rally. You can also see the weakening of the larger trend in the angles between subsequent lows.  (Click to enlarge the image.)

TD Ameritrade

I’ve drawn those ovals on RSI to show a technique I have for picking bottoms. It gets most intermediate term bottoms, and perhaps more importantly, it has a low false-positive rate. A rally becomes likely when you get a double bottom in RSI. This works on any scale you chose, from 1-minute to daily or higher. The likelihood of a rally increases if the second bottom on RSI is higher than the first. This is common because the middle wave of a decline is usually more intense than the final wave.

Now, this current juncture has such a double bottom signal, though the second RSI bottom is not higher than the first. It is also trickier because the first was formed by the latest black Thursday, May 6. I’m not sure how such an event should factor in, but it throws off our analysis somewhat. Perhaps the May 6 event should be discounted (it was really just 1 hour of trading that produced the reading) so that we can’t actually count this RSI bottom as a 2nd.

In terms of time, we’re just over 4 weeks into the decline, which is approaching the average for an intermediate-term decline over the last 3 years (the last one was very short at 3 weeks, and others have lasted up to 8 weeks).

Also of consideration is the extreme complacency that we are correcting. Look again at CPCE in the first chart above. From what I can tell, it set a record for complacency going back to at least the year 1999. This suggests we may have more decline ahead before an extended relief rally. Sentiment has turned negative, but not overwhealmingly so, and it has only been negative for a couple of weeks, so this is not a contraint to a further decline.

One more consideration is the 1930 parallel. Once stocks broke that April after their rally from the crash of ’29, they failed to rally hard for years. The decline was steady all the way down to the bottom in July ’32. In this analalogue, we would have another week or so of choppy and weak rally, followed by the bottom falling out, an outcome that would elegantly resolve our situation. The dip-buyers pile in, but the oomph is gone, momentum weakens and RSI turns down, then BAM, we’re back to SPX 750 this summer.

Prophet charts

I am approaching this situation by being neutral on stocks at the moment. I am holding a core position in December 2011 and 2012 SPY puts and some calls I’m short on IYR and GDX, though I sold a portion of the puts on Tuesday morning and and the rest are hedged with a short in VIX futures (I do this because spreads on options make them costly to trade in and out of). Essentially, I’m flat on equities.

I closed a ton of shorts from last Thursday to Tuesday morning, and went long SPX, ASX and Nikkei futures (and long CHF, EUR, GBP and short JPY and VIX) early this week when I saw divergences in the VIX, currencies and commodities (ie, stock indexes made a new low that was not confirmed with new extremes elsewhere, a buy signal) as well as a glaring RSI divergence on the hourly scale. Those “long risk” positions I closed for profits on Thursday and Friday, since we’ve already corrected the extreme short-term oversold condition and are in neutral territory. Equity-wise, I ended the week where I was on Tuesday morning, since the drop in volitility hurt my puts as much as my various longs made me money. Vol is a bitch that way — sometimes you time prices right, but it’s not enough.

Speaking of the VIX, I think it could settle down for a few weeks, though to a higher level than in April, before the next decline pushes it up again. I think it will remain elevated (as from Oct 2007 onwards) for many more months or a couple of years:

Prophet charts

In the commodity space I’m even more convinced that a major top is at hand, since some trendline breaks have been decisive (platinum, palladium, oil) and the declines have been so violent all around. Commodities tend not to rally as hard as stocks once the trend changes to down, so I entered shorts on oil, silver, gold, palladium and copper near their highs late in the week. The precious metals are looking particularly suspect to me here, and I still think my July 2008 double top analogue is in play.

The euro, Swiss franc and British pound are still looking very weak. Sentiment has been in the dumps for four months now, which is a set-up for a spectacular rally, but judging from their heaviness this week as stocks and commodities and CAD and AUD rallied, I think they may slide to one more low before that rally.

Storm rolling in from the East

Bloomberg.com

Mainland China was hit the hardest, down 6% today and 12% in a week:

Yahoo!

The deflation trade is on again. Commodities are down, bonds are up big, and the dollar and yen are up. Here are those two scripts vs. the euro, pound and Aussie:

Yahoo!

Funny how you can’t tell the difference between the euro/yen, Aussie/yen, pound/dollar, euro/dollar and Aussie/dollar. Throw some global stock indexes and Treasury bond yields in there and they’d blend right in, too, and probably even gold and a commodity index.

Yen:Euro cross as a measure of risk appetite

Jason Bourne asked for some thoughts on the Yen. Well, the poster Sleeping Bear over at Slope of Hope pointed out that John Murphy (a technical analysis grandmaster) noted the strong correlation of the Yen:Euro cross with the global risk trade. Here it is (blue) in Yahoo! versus the S&P 500 (red):

I feel like I should have made this a regular chart of mine ages ago, since the Yen strengthens versus the dollar when the deflation trade is on, while the Euro gets weaker, so of course these two should be paired for an extra sensitive indicator. Come to think of it, I even successfully traded the Yen:CHF cross last fall and winter, and the CHF trades like a slightly harder Euro.

Anyway, you can see the divergence in the chart last July, and more importantly in Feb-March where the Yen strength didn’t follow through as equities continued lower in their 5th wave. This was just the kind of hint you would expect in a 5th (ending) wave, along with the relative weakness in the VIX and Put/Call ratio compared to the panic conditions of Wave 3 (Sept-Nov). Yours truly was too dense to remember this, which is part of why he missed the rally bus.

Well, I see a divergence here again, but this time it’s bearish for stocks. The Euro has failed to make new highs  this summer as stocks have surged, and in fact the Yen has been creeping higher. This jives with my current read on an extreme in dollar bearishness. A dollar and Yen rally vs. the Euro, Pound, Loonie and Aussie would bode poorly for stocks and commodities. Conversely, if the Euro recovers after a correction and breaks out here, who knows how high stocks will go?

Ahh, panic is back.

Everything that was hot, all of a sudden is not.

For the past nine trading days, we’ve seen a rapid return of the kind of fear we experienced last fall. The carry-trade currencies (dollars and yen) and Treasuries have appreciated against everything else: stocks, the former bubble currencies (GBP, EUR, JPY, CAD, AUD, etc) gold, oil, grains and metals.

Today’s action was particularly convincing because of the breadth and extension of the equity sell-off, coincident with the VIX cracking 50, gold nearing 800 (a one-month low), and the 30-year Treasury yield pushing strongly back down to 2.9%. This across the board unwinding and preference for senior currencies and Treasuries is exactly what wave 3 of the crash looked like from September to November.

That’s all, folks.

I think we have seen all the bounce (Elliott wave 4) we are going to get off of the November 21 lows (Dow 7392). Too many bulls and bears alike were expecting a repeat of the November 1929 to April 1930 post-crash rally. Perhaps that rally was more powerful because it corrected a more oversold short-term condition, a 48% drop in 10 weeks that came right off the very peak of the preceding bull market. Animal spirits were still strong that winter, while the memories of rebounds and new highs were still fresh in traders’ minds. This time around, our rally only needed to correct a 35% drop over three months (Dow ~11,500 in August to Dow 7400 by Thanksgiving), while the underlying economic situation and social mood were in a more advanced stage of depression (at least a year into the economic contraction and two years into the housing bust).

The weakness of this post-crash rally is also another indication that we are in a larger degree decline than the depression of the ’30s, indeed a Greater Depression, as befits the aftermath of the largest credit bubble in all of history.

Targets and strategy.

At any rate, this plunge looks ready to take us much lower, probably well below 7000 on the Dow. I also hope that oil gets dragged to $25 and gold to near $600, where I will be a buyer of each for the multi-month corrective rally that should follow, prior to yet lower lows in equities (Dow 3000?) and mood.

I’m still holding many of my REIT, S&P 500, and miscellaneous stock puts from before the crash, and I intend to sell into the plunge just like the last time. If we bounce from here in the next few days, I’ll perhaps pick up some near-term puts for some extra oomph.

A bleak, bleak year ahead.

2009 will be the first time that it feels like a Depression to most people. Only about three million jobs were lost in 2008, and the crash came at the end, so most people have still been in denial about the severity of this event, or have yet to lose their faith in the Fed or the change in the White House. As stocks sink through their 2002 lows, house prices drop even faster, entire malls start to close, and huge waves of layoffs begin, the social mood will get dark and increasingly volatile.

Dollar kicks butt again.

The dollar carry-trade continues to unwind. The days of getting rich by borrowing dollars and buying anything under the sun are over. So much of that dollar debt is going to money heaven, so if you still have dollars you can get a lot more for them:

Gold fell $93 intraday:

The dollar was way up against the Euro (5-day view):

Source: Yahoo! Finance. Click image for larger view.

And the Loonie:

Source: Yahoo! Finance. Click image for larger view.

The Pound:

Source: Yahoo! Finance. Click image for larger view.

The Rogers Commodity Index:

Source: Yahoo! Finance. Click image for larger view.

And last but not least, you can now get a lot more Dow for your dollar:

Source: Yahoo! Finance. Click image for larger view.

Hard Currency? Hardly. The Swiss Franc is the Euro.

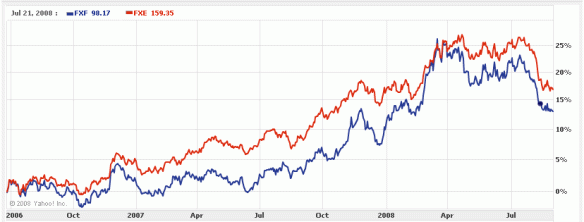
That’s what the market thinks anyway, and yours truly is feeling like a dope for not checking out some long term charts before trading dollars for Francs last spring. Here they both are against the dollar via CurrencyShares ETFs (Euro in red, Franc in blue):

Click for larger view. Source: Yahoo! Finance

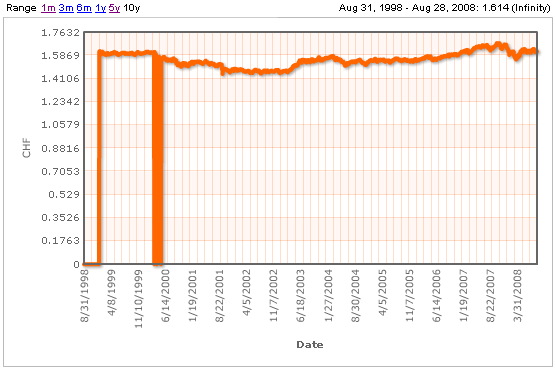
Here’s a 10-year shot (courtesy of Index Mundi. Ignore the spikes, must be a data feed error):

The market can barely tell them apart. From ’02 to ’07 the Euro dashed up about 50 US cents, but it only gained 20 Swiss cents, since the Franc was rallying too. Now that the European economy has turned and lower rates loom, a great reversal may be underway. But Switzerland never ran very hot, its real estate only appreciated by low single digit compound rates, and its bond rates have been puny for years, so there is no gap to be closed with the dollar. On the contrary, dollar rates have fallen to meet those of the Franc, so one would expect the scales to tip the other way.

So much for rewarding the prudent. Americans bring ruination on themselves but the ensuing deflation drives a powerful rally in their inherently worthless and ultimately doomed script. It will be very interesting to see how far this goes. Sentiment is still very anti-dollar, so we could easily get back to parity with the Euro in 2-5 years.

So here I have fallen victim to the rule that the market inflicts the maximum pain on the maximum number. In my haste to get out of a horribly flawed currency, I ran to the Franc on its reputation as the paper that has best held its value in the decades since the end of gold convertibility. I like the Swiss, and I still think they play the fiat game better than anyone, but currencies are all just slips of paper in the winds of public opinion, and public opinion doesn’t often follow the ‘fundamentals’ of financial analysis. It has its own natural patterns, which are not so easily formulated as interest rate differentials and purchasing power parity.


Pretty Chart of the Day: Gold in Various Currencies

Thanks to Lance Lewis at Minyanville for this image:

Mr. Lewis is an inflationist and gold bull, and his sentiments here pretty much sum up the mainstream rationale of that species: “Gold’s bull market isn’t just a weak-dollar phenomenon. It’s a function of inflation, just as oil and other commodities.”

To which I reply, gold’s bear market isn’t just a strong-dollar phenomenon. It’s a function of deflation, just as oil and other commodities. This applies in all currencies, as the credit crunch is global, just like the bear markets in stocks and real estate.