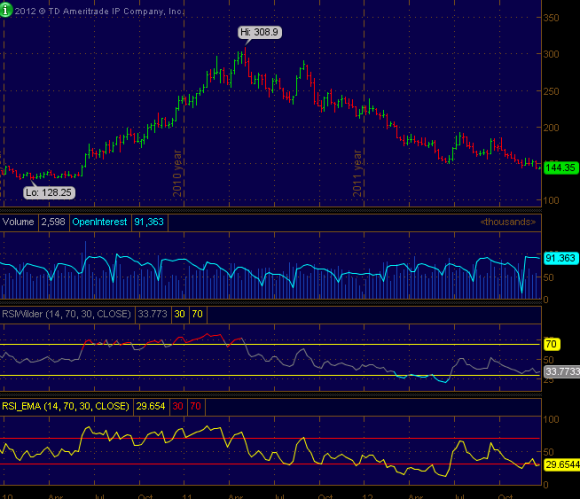
Coffee update: new lows, traders still very bearish.

Positive divergence on RSI though. At this point, I would say the market can continue to make marginal new lows for a while, but that a significant rally may be imminent. This market has continued demonstrate how relentless a downtrend can be after a mania (mid-2010 to mid-2011). As often as not, such a market returns to the base from which the ramp started (around $1.30/lb in this case). 

Image


Japanese yen getting oversold on low sentiment.

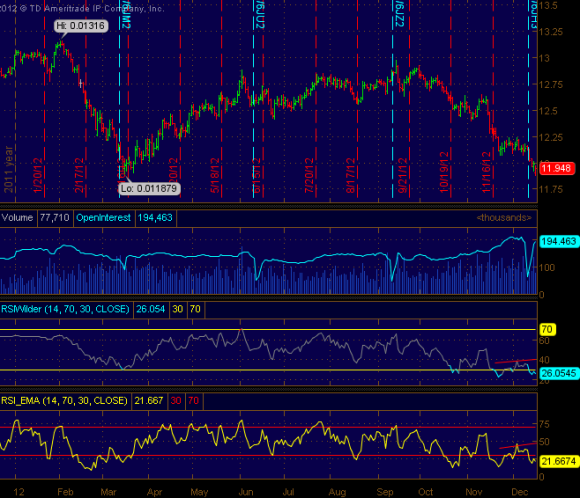
Traders are again very bearish on the Japanese Yen, just as they were back in March 2012, prior to its 8% rally against the USD. JPY/USD is also getting very oversold, as shown by RSI on a weekly chart.

Image

The daily chart is showing a positive divergence in RSI, a bullish sign:

Image

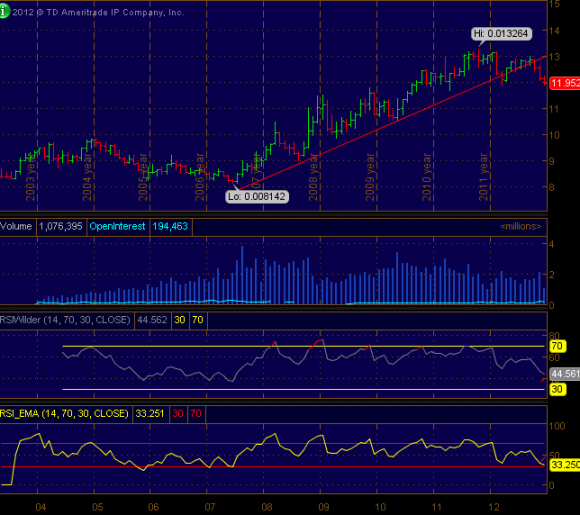
However, a glance at the monthly chart shows a major break of the uptrend since 2007, as well as a deterioration in RSI (diverting downward over the last 18 months).

Image

Traders are more bearish now than in March, but this condition has not yet been sustained for long enough to give the buy signal we had then. Also, I believe the yen may putting in a long-term top, due to the trendline break as well as developing trend of lower lows and lower highs in sentiment readings. Any multi-week rally that may be setting up should be viewed in that context, perhaps as an opportunity for entering a short position.

That said, a yen rally would fit into the global context of a nascent US recession and top in equities, as the yen and dollar have been safe-haven trades along with government bonds from the US, Japan, Germany and UK, among others. Sentiment on US equities has rebounded sharply since mid-November, when it reached oversold territory by some measures. Equity sentiment is not elevated, but if we are entering a bear market it need not become elevated before deteriorating again (a trend of lower lows and lower highs in sentiment was observed in 2007-2008).

One other interesting piece of data here is that Nikkei sentiment has been on the low side since mid-2011. Sometimes the yen and Nikkei have a strong negative relationship, other times positive, so I don’t know how this fits into things, unless Japan is finally going to reflate after 20 years of a bear market in stocks and strong currency and bond markets. We may indeed be at such an inflection point. I would certainly rather buy and hold Japanese equities than bonds here.

Who wants coffee?

Not many traders, apparently. Sentiment has been low for most of 2012, never even once reaching 50% bulls according to DSI. The latest slump has made futures traders extremely bearish on the beans for three weeks now, but in the first half of 2012 we saw this condition sustained for longer than I’ve ever witnessed on a contract. Despite a preponderance of bears, the price continued to slide, even at an accelerated pace, before a small rally this summer. Prices and sentiment have since returned to their lows.

Daily close, cents per pound:
coffee 2010-2012

Despite all of this bearishness and a 50% decline, coffee is still not particularly cheap by historical standards. It has been working off a mania that resulted in a parabolic doubling in 10 months from summer 2010 to spring 2011. I can’t publish the data, but picture bullishness alternating from medium-high to very high for the duration of that rally. This probably goes a long ways towards explaining the steady decline and bearishness. Prices have now returned to the base of that ramp, but if we look at a long-term chart, we can see that the spike was the final blowoff of a bull market coinciding with the general commodity boom, and that today’s price is still triple the 2001 lows. Commodities are cyclical and tend to swing from extreme to extreme, adjusted for inflation, so coffee wouldn’t be historically cheap today unless it were under $1.00/lb.

Monthly close (through Oct):
coffee 1982-2012
Indexmundi.com

I don’t see any great opportunity in coffee either way at present. It just makes an interesting study in herding behavior.

BTW, has anyone else noticed that retail bean prices at fancy grocery stores increased from the $7-10 range to the $10-13 range a couple of years ago? This coincided with the futures spike, but the correction hasn’t been passed on to consumers. Some players in the supply chain are likely enjoying fatter than usual margins.

This is why silver margins were hiked

Since the futures opened on Sunday, silver has fallen $13. For a standard 5,000 ounce contract this is $65,000, more than three times the COMEX margin. Today alone silver is off $15,000 per contract. It is just plain silly to claim a conspiracy against silver, and even sillier to claim that margins were hiked for nefarious reasons. Margin had to be hiked to keep up with the price of silver and its volatility, to protect the exchanges and winning traders (and to protect losers from themselves).

Like I said a two weeks ago at $45 when I discussed buying near-term puts on silver in anticipation of the bubble popping, I think the metal’s run is over. I suspect that it may establish a new normal in the $10-20 range for the coming decade or so, until the next secular inflation cycle is upon us.

Time for a bounce? (euro, stocks, copper, oil)

Here’s ES, 1-min scale:

RSI could use one more low, ideally at a higher level than the last to increase the odds of a rally.  The Nasdaq has diverged from the S&P 500 already though, and copper has a clear upslope in RSI:

EDIT: Here’s that higher low in RSI on ES that I was talking about and breakout from the downsloping trend:

Toppy action in dollar index, another rally in stocks coming?

The dollar index is showing waning strength on advances, and its rally is very long in the tooth. There could be worse times to take a short position on DX. At least there is a clear and close stop price at the highs.

Here’s the 2-hour bar, then the 5-min:

TD Ameritrade

Here’s what ES looks like to me this evening (5-min chart). There’s an upward divergence in RSI, indicating waning oomph on the sell-offs:

I took a long position in CHF and ES (SPX futures) after the close of regular trading today, and I’ve shorted some Treasuries and yen, but I’m still short oil, palladium (added to my position today), copper, silver, gold also added more today) and copper. I’m agnostic about the intermediate-term direction of the risk/inflation trade and just trading what I see: commodities look broken, but stocks still have rebound potential, as do the euro, franc and pound.

This chop and weak rally action in stocks precludes neither a big new rally nor a fall into the abyss. Big rallies like August-October 2007 or Feb-April 2010 have started slowly with chop like this and kept the bears confident. The timeframe for such a rally is limited, however, and if we don’t take off in another week or so momentum will peter out and we can start to roll over. This is what happened in late spring 1930 after the first hard leg down from the top of that post-crash rally.

There’s that weakness in ES

The short-term weakness in futures yesterday morning produced a 20 point drop overnight, and also painted a declining pattern in the 1-hour RSI. I covered an ES short in the low 1070s, since RSI is already into oversold territory with a double-bottom:

It would be nice to see a weak rally now to set us up for another big wave down, but we’ll see what happens.

Also overnight, CHF and EUR made new lows. I bought some CHF near the bottom and sold for a quick trade. GBP held up pretty well in comparison, by the way.

ES update (edited for clarity): stock futures still strong, but watch RSI for signs of weakness

We don’t really have waning strength yet on the hourly scale in SPX futures, but I can see the possibility. If this current rally leg (from Friday afternoon’s low around 1083) fails to break 1107 (Friday’s high) or does so on weaker RSI than the last rally, it will be a hint that the entire move up from 1036 is coming to an end. A fresh wave of selling will be even more probable if hourly RSI makes a lower low after a lower high.

Watch for weakening rallies and strengthening sell-offs to telegraph impending declines, even if prices are holding up (to be clear, we don’t have such weakening yet — I’m just watching for it). Prices often do stay elevated right up until a nasty break, like we saw from mid-April to early May (see chart below, ES 2-hour bar). You can also see the strengthening rallies and weakening declines since the bottom last week (the bottom was less strong than the preceding wave down, which is a classic buy signal).

Here’s the ES hourly. Still showing strength, but it would be bearish if this current wave does not get at least as powerful as the last.

And 15-min bar… this one shows weakness, but it’s too early in the wave to be sure.

All charts from TD Ameritrade

Today is a trading day for most of the world (and US futures are trading, though on a cut schedule), so don’t think that prices will wait for 9:30 EST Tuesday to make any important moves.

Remember, we have a rather neutral set of conditions on the daily chart, but the Elliott Wave crowd is looking for a hard third wave down anytime, and last week’s action could serve as a perfectly functional 2nd wave. If there is a third wave coming, it will be more powerful than the decline from 1220 to 1040, possibily taking us under 900 very quickly. Judging by May 6, the market has signaled that it is capable of such a move, and relentless declines are common following bear market rallies. Also in favor of such a move are the continued dollar and yen strength, anemic rallies of the euro, chf and pound, and the fact that the commodity complex is looking broken.

If you can’t tell, I am ambivalent about stocks now and positioned appropriately flat at the moment. These are not good junctures to trade, since the signals are so mixed.