Gold stocks oversold and underloved

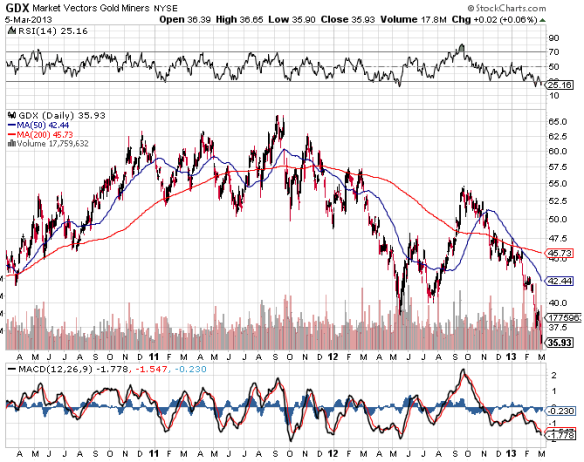
Sentiment and price action are extreme. Combined, they make a very strong case for a rebound.

gdx march 5

Gold stocks are also very cheap relative to the broad indices, as well as gold itself (which is also the most under-loved since it was $300 per ounce).

gdx to spx march5

gdx to gold march5

Images from stockcharts.com

Gold itself is still very expensive relative to other hard assets and financial assets on an historical basis, but trader sentiment is bleak, a contrary indicator. From 2001 to the top in 2011, we never had such a long down streak on such bearishness, which may indicate, despite its short-term bullish implications, that the bull market may have topped at $1920 per- in August 2011. We had parabolic moves on extreme bullishness in gold (peaking 8.11), silver (5.11) and platinum (3.08), and moves like that tend to burn up all reserves of excitement and mark tops for years to come.

Gold:Platinum ratio dips under 1.0 for first time in 8 months.

Platinum has had a sharp rally in recent sessions, while gold has been only slightly higher, bringing the two heavier precious metals (specific gravity of 19.30 for Au and 21.45 for Pt) to parity for the first time since April. The ratio remains high, and has been elevated since gold left the more-industrial platinum in the dust in the summer of 2011:

This has been one of the longer periods of inversion in recent history. Selling gold and buying platinum in equal weights when the ratio is well over 1.0 has been a dependable money-maker for patient traders, as the ratio tends to revert to well under 1.0.

Stock jitters, Gold and JPY still compressed

Gold and the yen each worked still lower this week on highly depressed sentiment readings. Each of these has had a negative relationship with the “risk trade” lately, falling as stocks have rebounded from their oversold and overbearish condition of mid-November. Now, stock sentiment has recovered to neutral territory, and traders are afraid of these sometime “safety trades.”

Trader opinion gold has been very low since late October, a full eight weeks ago. Every similar instance in the past several years has been followed by a substantial multi-week rally. That said, if the bull markets in precious metals and the yen are indeed over, we should expect downtrends to become more protracted, with sentiment remaining low for longer.

Here’s a 1-year daily chart of gold:

1-year daily JPYUSD:

I’m holding to a thesis that the risk trade is topping out here as the US slides into a recession that remains largely unrecognised. Tops are rarely sharp peaks, but consist of several months of choppy sideways action during which sentiment deteriorates from giddy to nervous and the VIX picks up even before prices have fallen substantially. I view the rebound since mid-November with that context, akin to the action of April-July 2011 or pretty much all of 2007.  Last nights mini flash crash in stock futures fits into that context of a increasingly jittery market.

We’re three months from the 4-year birthday of the (presumably) cyclical bull market. It is now older than most cyclical bulls within secular bears, though the last bull phase lasted from March 2003 to October 2007, 4.5 years.

Another cyclical bear and a recession and drop in corporate earnings may finally compress multiples to the investable levels required to build a solid base for another bear market. I don’t expect this to happen quickly, though, since prices have a long way to go before we see anything that can be called historically cheap. I wouldn’t be surprised to see stocks hold at or beneath current levels for the rest of this decade as inflation creeps in towards the end and boosts earnings, as happened during the latter stages of the last three secular bear markets (roughly the 1910s, ’30s, ’70s).

Intermediate-term set-up for a gold rally?

Traders have been bearish on gold and gold stocks since late October, the longest stretch in recent years. All such previous instances were followed by significant multi-week rallies. Here’s a daily chart, showing some divergence in RSI.

Here is GDX, the gold miner ETF, which looks good technically, as well as being cheap vs. the metal itself:


A caveat here is exemplified by the coffee futures market (see recent posts), which has steadily declined since a manic high 18 months ago. Gold and silver experienced a mania around the same time, which perhaps capped their 11+ year bull run. If that is the case, a situation like the present could actually resolve not in a rally, but in a crash, as crashes may develop from oversold and bearish conditions that would otherwise be bullish. For this reason, as well as the value discussion below, I would be careful about any longs and use a stop-loss.

I still maintain that gold is overvalued relative to a meaningful basket of other assets and metrics. Today, a kilo of gold buys (or rents) you more real estate, commodities, labor, automobile, etc. than at any time in modern history, save bottoms in those respective markets and tops in the metal.

This doesn’t mean that gold can’t rally for a few weeks or months or even make a new high – it just means that doing so would make it even more historically overvalued. The time of gold being a great value has long passed. It has done a very nice job at protecting holders against the Federal Reserve’s war on savings, just like it did a good job at protecting against inflation in the late 1970s, but gold peaked prior to inflation, and today gold may peak prior to the end of Bernanke’s tenure.

I often make the point that gold is not the only hard asset. In an inflationary episode, there are many ways to play. The dollar lost 2/3 of its value from 1980 to 2000, but over that period gold lost 90% of its value when adjusted for inflation (70% nominally). As in equity investing, the price you pay determines your return. I would look for hard assets that are closer to historical lows, or at least mean values, rather than something near a high.  Distressed real estate comes to mind, or even Japanese equities.

Heck, if we get another cyclical equity bear market within the post-2000 secular bear, there will be plenty of hard, productive assets available for reasonable prices in the stock market. BTW, every episode of double-digit inflation in the US since 1900 has ocurred during the latter years of a secular bear market in equities (1919-1920, early 1940s, 1979-1982). Thanks in large part to Mish‘s explanations of the credit market, I have been a deflationist since late 2007, despite the shrill warnings of the hyperinflation crowd. There is no telling how long our own Japanese situation lasts, but we likely have at least a couple more years to go.

A look at the real value of gold on an historical basis.

I like making random gold ratio charts in stockcharts.com since it lets you chart the ratio of anything: gold:oil, gold:copper, gold:SPX, etc:

If you do this kind of analysis on a longer-term basis, you see that gold is getting a bit expensive relative to other commodities, capital goods or labor (or you could say that each of those things is getting cheap when priced in gold). What is clear is that gold is no longer cheap by any measure. I don’t think this type of analysis has anything to do with where gold price goes in the near-term (technicals and sentiment drive that), but it’s helpful to think about where gold is on an historical basis.

  • The Gold:Oil and Gold:Copper ratios are moderately high, and would be off the charts if oil and copper were to crash.
  • Rent on a nicer 1BR apartment in Manhattan has fallen from 8 ounces in 2001 to 2 ounces today. This is about what it cost in the 1920s-60s.
  • 10 ounces in 2001 bought a 12-year-old Honda Civic, and now it gets you a brand new one with extras. A Model T Ford cost 15 ounces by the 1920s. The VW Beetle cost 30-50 ounces in the ’50s.
  • Median family income in was about 50 ounces in 1920, 90 ounces in 1955, over 100 in 1965, 70 in 1975, 75 in 1985, 95 in 1995 and way over 100 in 2000. Today, it’s about 30.

On a purchasing power basis, gold is adequately priced – it is certainly no longer cheap. Of course, markets don’t care about this on anything but the longest term – gold was overvalued at $500 in 1979, but it still spiked over $800 and then fell to a ridiculously low level in 2000. In the scenario where the dollar goes to zero, everything will soar in dollars, not just gold, so you’d still have to evaluate gold in terms of goods and services.

I’m still in the dollar bull camp for the foreseable future. Treasuries are pointing the way (record low 10-year yields, 3.5% on the 30-year, almost like Japan), and it looks like another bout of deflation is underway, if you define deflation as a contraction in money and credit (if credit is marked to market). Europe’s soveriegn debt implosion is deflationary. The same goes for the Australian real estate collapse and the pending RE collapses in China and Canada, and the US muni and junk market troubles.

I don’t see the dollar as any worse fundamentally than the euro or yen, and much better technically. Japan’s history since ’89 is proof that printing and spending and running up huge public debt doesn’t necessarily kill your currency. When there is too much private debt going bad but not being written off, it overwhelms the mismanagement of the currency and props it up. It doesn’t matter what you think of the fundamental value of the dollar if you’re in debt and can’t find enough dollars to make your payments. And until asset and labor prices and demand for goods and services can justify borrowing costs, there’s no credit expansion so no inflation.

Sentiment-wise, we’ve still got a great long-term case on the long-dollar trade. Fear of the dollar has been widespread since early 2008, but the DXY has just bounced around sideways – no crash. The crash happend from 2000-08, while nobody but old-school Austrians noticed.

Max caution alert: exit or hedge all market risk

This is one of those times where markets are stretched to the limit and any further upside will be minimal in relation to the extreme risk entailed. Sentiment has been dollar-bearish and risk-bullish for so long that a violent reversal is all but guaranteed. This is not to say that the absolute top is in, but that at the very least, another episode like last April-June is coming up.

Watch for a sharp sell-off in stocks, commodities and the EUR-CAD-AUD complex. Even gold and silver are vulnerable, especially silver. We could be near a secular top in silver, where the recent superspike has all but gauranteed an unhappy ending to what has been a fantastic technical and fundamental play for the last decade. Gold is much more reasonably valued and should continue to outperform risk assets because the monetary authorities are so reckless, but there is just too much froth in silver to hope for even that.

The rally since early 2009 has been not just another dead cat bounce in the bear market from 2007 (like I thought it would be), but another full-blown reflation and risk binge like the 2003-2007 cyclical bull. The secular bear since 2000 is still here, and valuations and technicals suggest that another cyclical bear phase is imminent. There is no telling how long it will take or how it will play out, but the only prudent move at times like this is to take all market risk off the table. Bears still standing should think about going fully short. Anyone holding stocks should sell or get fully hedged. History shows that the expected 10-year return on stocks from conditions like this is under 3.5%, and such a positive figure is often only acheived after a major drawdown and rebound. See John Hussman’s excellent research on the topic of expected returns from various valuation levels: http://hussmanfunds.com/weeklyMarketComment.html

Want to know what a secular bear looks like? Check out 1966-1982: a series of crashes and rallies that resulted in a 75% inflation-adjusted loss. In the absense of 70s-style inflation, this time the nominal loss should be closer to the real loss. Think Japan 1989-who knows?

The headlines this time around should have less to do with US housing, though that bear is still raging. We’re likely to hear much more about European sovereign debt, where haircuts and defaults need to happen, and Canadian, Australian and Chinese real estate. When the China construction bubble pops it will remove a major fundamental pillar from the commodities market.

There is no safe haven but cash, and cash is all the better since everyone has feared it for so long. If I had to build a bulletproof portfolio that I was not allowed to touch for five years, it would be something like this: 20% gold bullion, 25% US T-bills, 25% US 10-year notes, 25% Swiss Francs (as much as I hate to buy francs at $1.13) and 5% deep out-of-the-money 2013 SPX puts (automatic cash settlement).

There will be a great value opportunity in stocks before long (the tell will be dividend yields over 5% on blue chips). It’s just a matter of having the cash when it comes, so that you aren’t like the guy who said in 1932 that he’d be buying if he hadn’t lost everything in the crash.

PS – For those of you who think QE3,4,5,6 will save the markets, I’ll counter that it doesn’t matter, not on any time frame that counts. Risk appetite and private credit are what matter the most, and the Fed can’t print that. At 3AM, spiking the punchbowl doesn’t work anymore.

Or I can put it this way: the Fed has increased the monetary base from 850 billion to 2500 billion since 2007. Have your bank balance, salary and monthly bills increased 200%? If not, why should stock and commodity prices? Not even Lloyd Blankfein is 200% richer than four years ago.

Silver superspikes: dollar-bullish, and they don’t last

First, the 25-year monthly chart:

Here’s a chart that goes back further but only goes up to 2010 (I couldn’t figure out how to get barchart.com to draw me the whole thing, but you can just use your imagination – the line just goes straight up from $30 to $45):

Gold’s march upwards has been much more orderly, but silver is a thin market and prone to spikes. These things are tough to short, and to attempt to do so you should wait for a pause and use a stop above the highs, but even with a stop a fast market like this could spike dollars in minutes or seconds and close you out at a big loss only to reverse. This chart doesn’t show the action that happened intraday one day in Jan 1980 when silver traded over $50 very briefly.  No reason why it couldn’t spike to $70 next week only to crash and languish at a new normal of $10-20 for the next two decades.

It is safer in a way to buy puts than to short SLV or sell futures, since your risk is defined – you can only lose what you put up. The July 35-strike puts on SLV were going for less than 60 cents on Wednesday, and will get cheaper every day until silver falls. June 35s are under 40 cents and will decay faster but pay off better in a crash. At any rate, I’d take a disciplined approach and figure on losing my premium at least once, buying higher strikes if the spike continues upwards. Losing the first premium or two would be acceptible if a later position pays off 10:1.

Take another look at this long-term dollar chart. We had a major bottom in 1980 just as everyone was panicking into precious metals.  Silver spikes are apparently another symptom of extremely negative dollar sentiment, so should be considered bullish for the currency.

BTW, though gold’s price and action is much more sensible, the silver spike is very bad for gold as well – it may just have doomed its bull market. The metals have more than adjusted for the inflation of the last 30 years and the money printing of the last 3. It would make sense for their run to end soon and for them to settle into some middle ground. That doesn’t mean gold can’t touch 2500 and silver can’t hit 100 – it’s just that these moves are too fast and too high relative to their historic multiples to other assets, so these prices will not last.

Long-term gold charts (first one is a few weeks old – the second is current but doesn’t go back as far):