Commodities running out of steam.

The trend was smartly broken back in January, and now this bounce looks like it’s exhausting right about where the old support line would be. These are the various popular commodity indexes, from Bloomberg:

.

.

.

.

.

.

.

.

You can see this loss of momentum in the former leaders: gold, silver, oil, copper, sugar and cocoa have all failed to make new highs as stocks have surged over the last month.

This is a strong sign that the urge to speculate is fading. Without that, there is nothing to keep prices up, since demand is very low for everything from oil to wheels of parmesian cheese (remember the cheese bailout in Italy?) compared to the 2008 commodity peak. When commodities fall, they often drop straight down. No class of assets declines faster. See this weekly chart of sugar for a case in point:

futures-tradingcharts.com

If you are looking for short ideas among commodity stocks, this is a neat tool: miningalmanac.com (I think so anyway, but then I’m part of the team that’s building it).

Select the exchanges you trade on, then look for stocks without a lot of “burn time,” in other words those that may be running out of money. Or look at the “financial strength” tab to see who has too much debt and too little cash. Right now this beta version has mostly Canadian companies, but it’ll have almost every mining stock in the US, Canada and Australia before long.

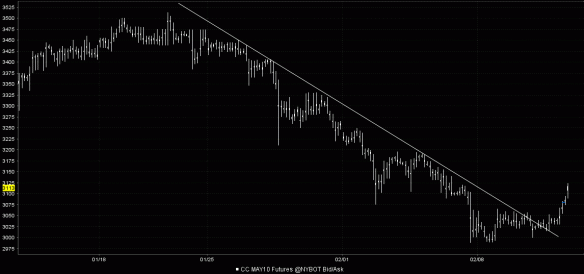
Cocoa has broken out

Ok, cocoa is a pretty obscure market, but it tends to move with the rest of the commodities, which in turn behave like other risk assets including stocks and non-dollar, non-yen currencies. Cocoa futures, like copper, just broke out of the downtrend that contained their decline from the January highs:

Interactive Brokers

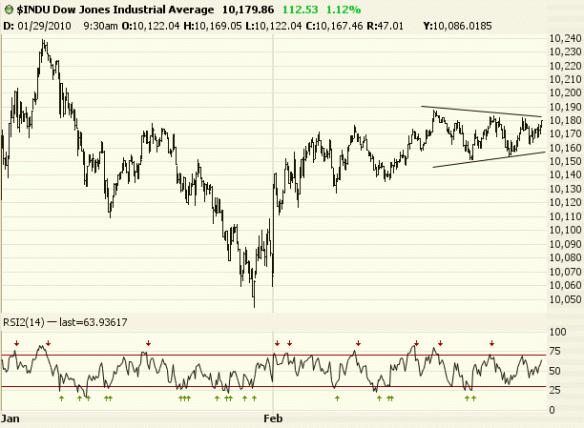
Looking better for the bulls

We’ve rallied and then drifted higher all day, instead of falling right back like after last week’s little rallies. In the process the Dow has formed a contracting triangle, indicating more upside in store:

Source: Prophet.net

Also a weak day for the dollar and good day for commodities, especially platinum and palladium (I was stopped out of both positions this AM for nice profits). I’m waiting on another short entry in that space, though I remain short Ovaltine (cocoa and sugar).

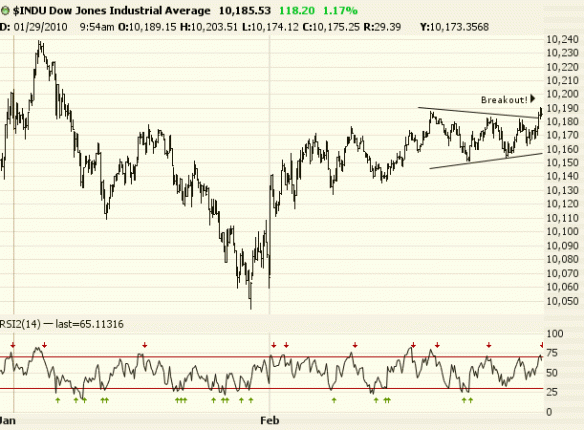
UPDATE (post close): We’ve got a breakout from that triangle…

Stocks oversold, but does it matter?

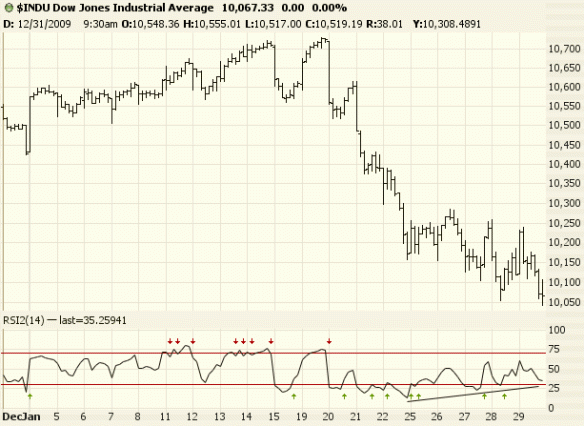
Here are the last 20 trading days of the Dow in a 60-min chart.

Source: prophet.net

Note the upward divergence in the bottom RSI, indicating that each downward movement since the 22nd has been weaker than the last. This can be an indication that the urgency to sell is waning. Perhaps it is all part of a corrective pattern within a downtrend that has set us up for another fast plunge, but it would also be expected if were about to rally strongly and correct the whole drop from 10,700.

At any rate, as of Friday’s close we were oversold and due for at least a minor rally. I had loosened my hedges earlier Friday, but I tightened them after the close and more on Sunday evening.

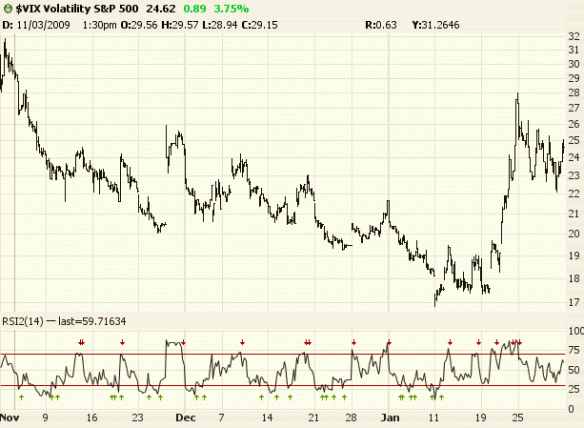
Here is the VIX, in a 60-day, 60-min chart. I think last week’s oscillation pattern could be somewhat troubling for the bulls, as it looks corrective:

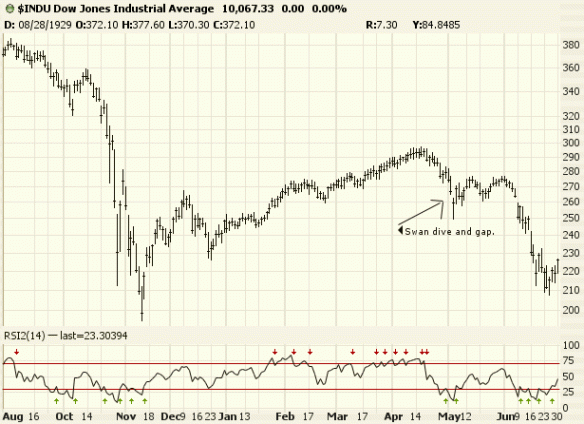
It reminds me that during the breakdown in spring 1930 there were no major countertrend rallies until the Dow had taken a swan dive, culminating in large gap-down day. Maybe this week brings such a move to thoroughly shatter the bulls’ complacency about this being a mere speedbump on the way to the 2007 highs.

Here’s summer ’29 to summer ’30:

Here’s an update on copper, last trading at $3.05, off 50 cents from its highs. It has no business being anywhere near the 2007-2008 levels in this economy, as those levels were never sustainable anyway:

Source: stockcharts.com

It is still not oversold after this plunge, and I suspect that the retracement back towards the $1.50 area will be blindingly quick. I could put up a bunch more base metal charts that look just like this.

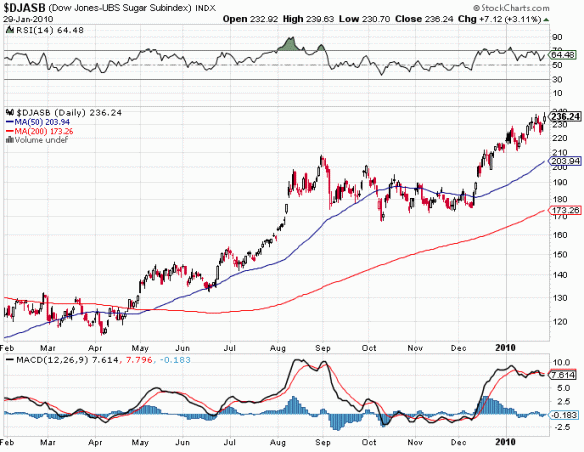
The best performing commodity of the past 12 months is probably sugar, which clocked a new 30-year high last week:

I’m short, and I like the negative divergence in daily RSI, as well as the fairly clear wave count (5 of ’em, with a contracting triangle 4th wave this autumn indicating that this spike should mark the end).

Cocoa also set a 25 or 30 year high recently, and it’s historical pattern is similar to sugar’s. It’s another pet short of mine, and I like that the latest attempt at a new high has failed and that the uptrend is now broken:

Source: Futures.tradingcharts.com

Cocoa cooling off?

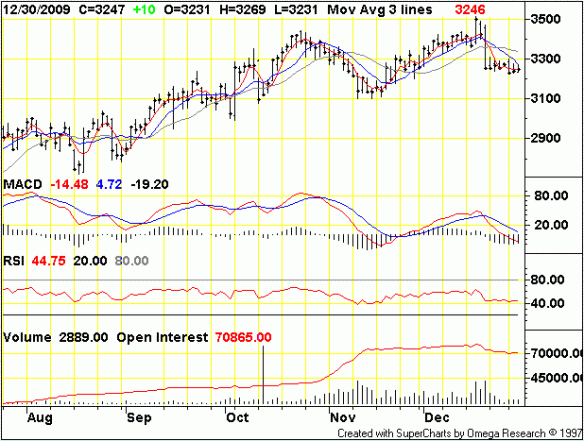
I follow all sorts of odd commodity futures, since the more you follow, the more set-ups you can potentially find. Cocoa got my attention a few weeks ago as it made a 30-year high on lower momentum than its previous high, and I took a short position when it stalled out at over $3400 per metric ton. It had a violent sell-off several sessions ago, and has so far failed to rebound, suggesting that animal spirits may be waning. This is a daily chart going back to August:

Source: futures.tradingcharts.com

You can see in this monthly chart that if this new high does mark the end of the bull market, even a retracement of the last leg would take prices to the $2500 area:

The 25-year view shows how cocoa futures are part and parcel of the larger commodities complex:

Like other commodities, cocoa was very expensive in the mid-to-late 1970s, with inflation adjusted prices about triple or even quadruple today’s high prices (i.e., nominal prices ranged as high as $4000 in 1978-1979).

Commodities roundup

Hi all. Sorry for the long span between posts. I’m going to try to be a bit more diligent about daily postings, as I was in the earlier days of this blog, even though things aren’t as exciting as they were the second half of last year. After all, there is always market action somewhere, and government is an endless fount of stupidity.

The currency, cocoa, sugar, natural gas, and of course gold markets have been of interest lately.

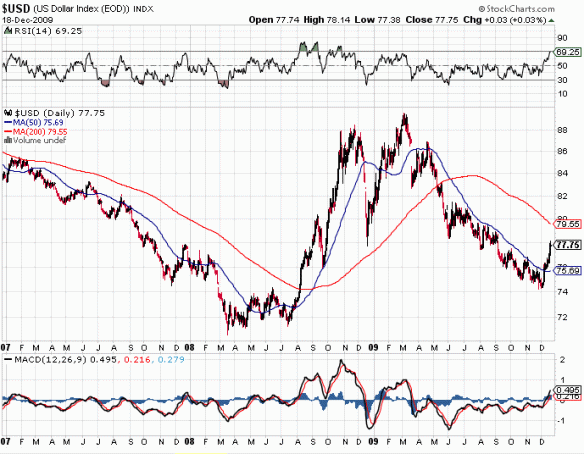
Let’s start with King Dollar, sprung from the grave. This of course is a warning to all stock and commodity bulls to keep an eye on the exit. My target here is over 90, maybe even 110 (meaning the euro could fall under parity).
Here is a 25-year chart of cocoa, which clocked an all-time high this past week at nearly $3500 per metric ton (1000 kg):
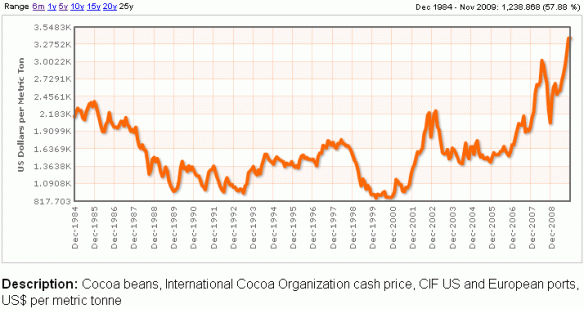
Source: Indexmundi.com (a wonderful compendium of long-term charts and all sorts of data)

I’ve got a short position in cocoa from 3406. Friday was a big down day, with a drop of as much as $130 per ton off of Wednesday’s record in the high 3400s). This is a very thin market, in which it’s impossible to finesse positions, so I’m just shorting and holding. Cocoa tends to move with the broader commodity complex, last having topped in mid-08 with the rest of the bunch. For its own reasons it has outpaced everything this year but our next feature, sugar:

In this 2-year daily chart from stockcharts.com, you can see a classic 4th wave triangle consolidation over the last few months:
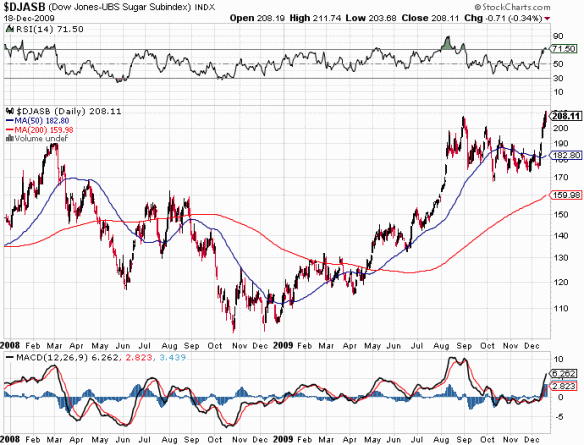
As prices drifted slightly lower in an ever smaller range, DSI bullishness declined to about 20%, meaning that most traders believed that the highs were in. After all, sugar hadn’t been above 20 cents per pound since the 1970s, when it had gone from under a penny to 60 cents! Here’s a chart from 1961-2006 in which you can see those monster spikes (the 1974 peak would equal about $2.50 in today’s prices):
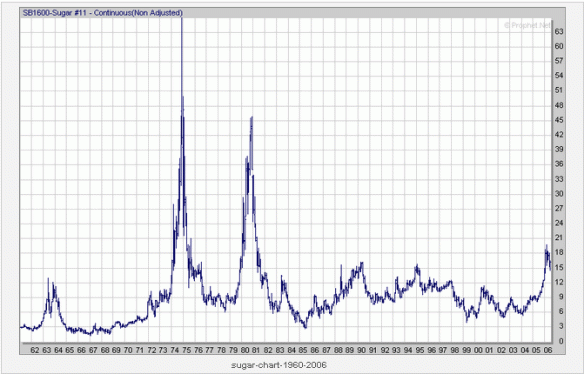
Now, I’d stay out of the way of this blast-off (and maybe even participate if we get a pullback with a clean stop), but when it exhausts there will be nothing but air under this market.

On to oil… I think $70 a barrel is nuts in this economy, and that this year’s rally is just the natural reaction to the $100 decline off the July 2008 peak.
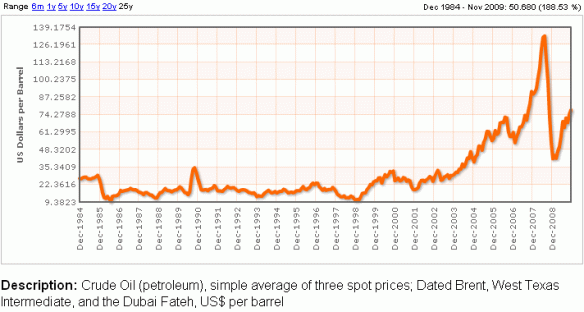
That doesn’t mean we can’t vault higher still, but even considering that global production is likely peaking, the price just doesn’t reflect the drop in demand. Don’t tell me about China — China is still due a major set-back to liquidate its own bubble. I highly recommend the preceding link to Mish’s site. Few understand the extent of debt-driven malinvestment in the People’s Republic.

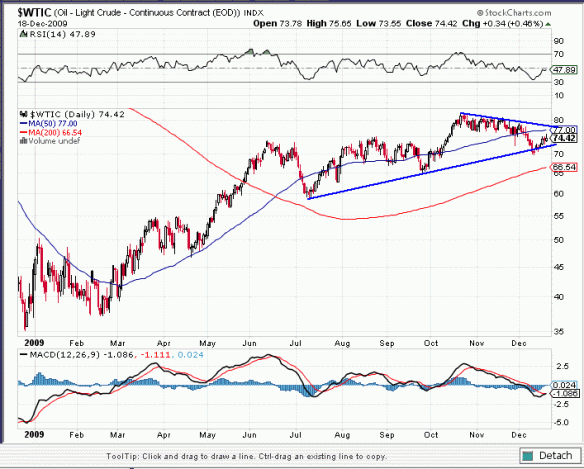
Here’s a 1-year view of West Texas Intermediate crude. Note how it violated support last week, indicating flagging momentum. Once this bounce exhausts, there could be a very nice short set-up:
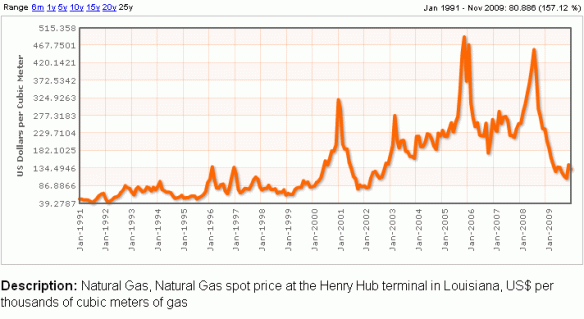
Here’s a 25-year view of natural gas:

What’s remarkable about this fuel is that because storage capabilities are so limited, and because of the nature of its use as a heating fuel and for electricity generation (gas plants are the most expensive to run, so many are only turned on during peak demand days), it is prone to tremendous spikes and deep valleys.

What the above chart makes clear is that 5-6 dollar winter gas is on the cheap side of things for this decade, so even if demand is soft (and it is), a spike is possible. That said, I don’t think it’s likely, because we’re not quite due for one yet. Gas has only been of interest to me lately because it formed a nice slope into a bottom this summer, then ramped up in September and re-tested the bottom this month. The re-test was a nice long entry, and I rode the futures from $4.50 to a shade over $5.00 (silly of me to tighten the stop too much and miss the last $0.80).
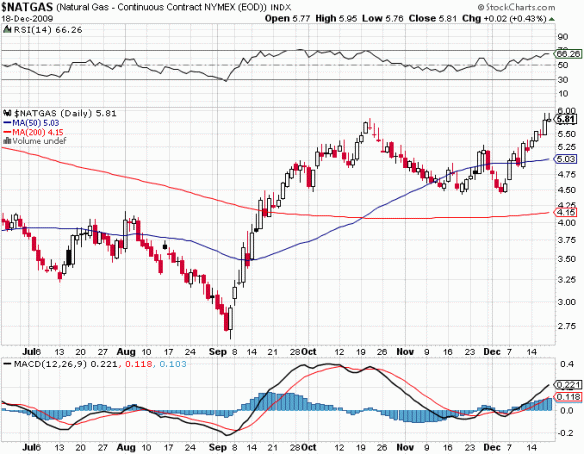
I’d look to get back in here on a pull-back with a neat stop (tough to get in this volatile market), since there seems to be plenty of momentum left.

Now onto everyone’s favorite commodity lately, gold. Here’s a chart from 1974 to present from kitco:

You all know my opinion. I think this bull market has started a major set-back, similar to the ones that started in April 2006 and March 2008, the peaks of previous parabolic runs that ended after weeks of extreme bullish sentiment. I’m going to continue to trade the short side off of rallies. I covered my short from $1215 at $1150 last week, then traded a small bounce, and have since attempted a couple of long positions only to have them taken out. In past months, we would have had a nice snap-back rally by now, but like the euro and carry-trade currencies, this market is looking very weak. Note how it has now broken its 50-day moving average:
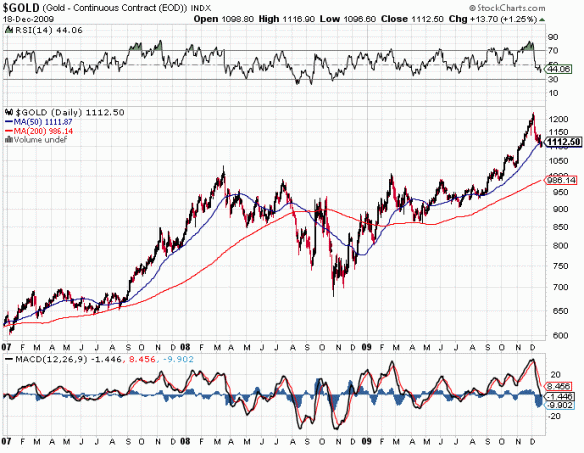
For now though, I do like the long side of gold and hope that we get our corrective rally soon, firstly because I’d like to play it, but more importantly because it would provide such a nice short entry. Downside momentum seems to be stalling around the $1100 level, even as the dollar has chugged ever higher.
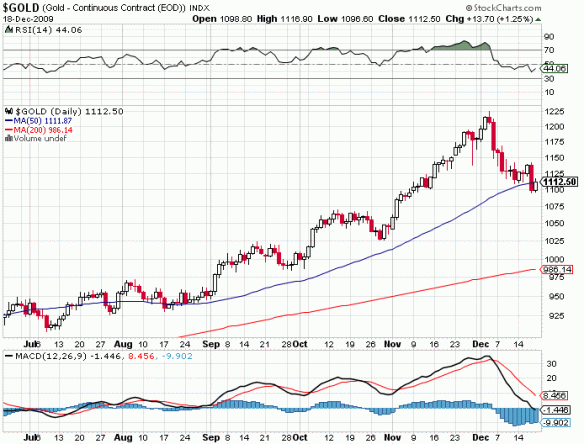
RSI seems to be rounding out, and the $1095 is a pretty clear stop, so the short-term odds seem to favor a long position. Who knows, maybe the big rally isn’t dead yet. We still haven’t busted cleanly through the 50-day average, though with the dollar having turned with such gusto much of the impetus for the rally is gone.