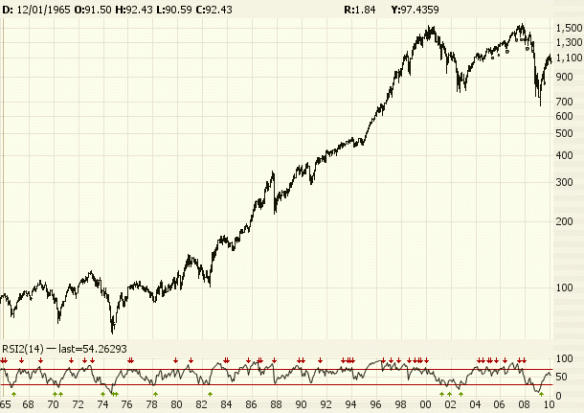
20 day average put:call now at 3-year low

This powerful fear guage is registering the most complacent atmosphere in at least three years, if not ever:

Indexindicators.com

Mutual fund cash levels are also at all-time record lows, and spreads on junk bonds are tighter than ever. All markets seem priced for Goldilocks perfection.

Goldilocks is back, better watch out

It’s official: Goldilocks is back, at least for junk bonds, according to a JPM analyst quoted in Bloomberg:

March 29 (Bloomberg) — Junk bond sales reached a record this month as rising profits and record low Federal Reserve interest rates foster lending and investment to the lowest-rated borrowers.

Companies worldwide issued $38.3 billion of junk bonds in March, passing the previous high of $36 billion in November 2006, according to data compiled by Bloomberg. Yields fell 0.95 percentage point to within 5.96 percentage points of government debt, the narrowest gap since January 2008, Bank of America Merrill Lynch index data show.

This is “an almost ‘Goldilocks’ environment for leveraged credit markets,” JPMorgan Chase & Co. analysts led by Peter Acciavatti, the top-ranked high-yield strategist in Institutional Investor magazine’s annual survey for the past seven years, said in a March 26 report to the bank’s clients.

Sales soared as investors plowed a record $33.6 billion into speculative-grade funds this quarter, according to Cambridge, Massachusetts-based research firm EPFR Global. Bonds of Stamford, Connecticut-based Frontier Communications Corp. and Consol Energy Inc. of Pittsburgh, which sold a combined $5.95 billion of debt last week, rose about 2 cents on the dollar to 102 cents.

That’s a turnaround from February, when companies canceled sales at the fastest pace since credit markets began to freeze in 2007 amid concern that the inability of European governments to trim their budget deficits will threaten a global recovery.

Loan Revival

About $20 billion of high-yield, or leveraged, loans have been completed in February and March, compared with $38 billion for all of 2009, according to New York-based JPMorgan. Speculative-grade securities are rated below Baa3 by Moody’s Investors Service and BBB- by Standard & Poor’s.

Elsewhere in credit markets, yield spreads for company bonds shrank by an average 3 basis points last week to 151 basis points, or 1.51 percentage points, the narrowest since November 2007, according to Bank of America Merrill Lynch’s Global Broad Market Corporate Index. Yields rose to 4.02 percent from 3.98 percent. …

Looks like credit investors are “all-in” again, just like the stock market crowd. This never ends well.

…“Appetite is definitely there,” said Joel Levington, director of corporate credit for Brookfield Investment Management Inc. in New York, which has $24 billion in assets under management.

Sales of high-yield bonds in March more than doubled last month’s total of $16 billion, driving issuance this year to $78.5 billion, the busiest quarter on record, Bloomberg data show. High-yield companies, taking advantage of the lower borrowing costs, said they planned to repay debt with proceeds from at least $20 billion of this month’s sales.

“The mindset of investors is that this spread product is ideally situated for this kind of macro environment,” said Charles Himmelberg, the chief credit strategist at Goldman Sachs Group Inc. in New York.

Just what macro environment might that be? Silly me, I thought we were sliding down the backside of a credit bubble.

Weekend charts

When the short-term gets hazy, remember the big picture.

The drop so far (about 6% in 12 days on a closing basis, 9% in 13 days intraday):
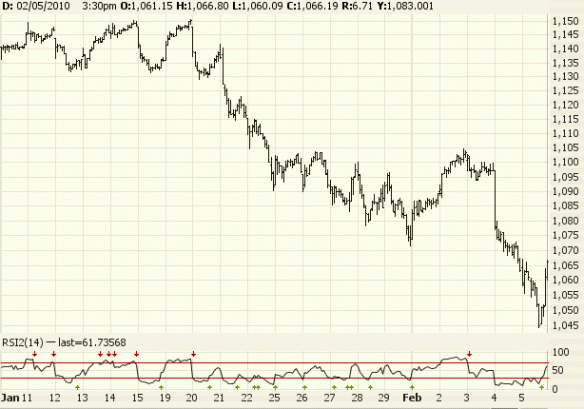
Source: Prophet.net

Here are the conditions I am watching: RSI on the daily scale is now oversold. However, DSI bullishness has dropped from near 90% to the 30s, which still leaves a little room on the downside for a first wave down from a big bull move (these sell-offs often end with about 20% bulls). Put:call is still very low for the bottom of a sell-off of this intensity. The VIX also has room to run, since it has still not cracked 30.

The deeply oversold hourly RSI, the swiftness Friday afternoon’s 2% snap, and the daily reversal bar (new low, then a close above the previous close) suggest that a countertrend rally has just kicked off, but if that is the case, it is from somewhat more subdued conditions than often mark the end of sell-offs of this type (a sudden drop after a long, smooth trend upward on great complacency). If this were 2009, the market would respect the current oversold condition, hold and then rally, but the Great Bounce is over, and the character of the market has changed. Although it feels like we’ve already filled our panic quota, the put:call ratio, VIX and DSI leave open the possibility of a very sharp (3-6%) intraday drop early this week from which the market would recover quickly and rally for several days or weeks.

Another possibility, and I somewhat favor this one, is that the rally from Friday’s lows is meaningful, but will not retrace as much of the decline as rallies from bottoms with more signs of panic. In this case, I’d be looking for a top no higher than 1100 on the S&P.

This is a tricky juncture to trade, since there is no near-term expectation of anything but volatility. I would not want to be levered short nor long here. A trader could go long against Friday’s lows for a quick trade, or stay short while ready to absorb a 5% or even 10% rally. Traders with modest, unlevered short positions (not inverse ETFs) can relax and just check the market each evening and not worry about the chop or even a big retracement. The real money is made in the sitting, as Livermore said. 50 points is not worth getting shaken out of 500.

Deflation has been here all along; the markets just pretended otherwise.

I sure wish I’d sat tight on all of my (levered) shorts from January: stocks, sugar, cocoa, oil, copper, platinum, palladium, silver, euro, Swiss franc, New Zealand dollar, South African Rand. ALL of these have fallen heavily. I captured 1/4 – 3/4 of their respective drops, so it has been a great three weeks, but I would have been served so much better by just letting everything run than attempting to finesse positions. This across the board selling, with strength in the dollar, yen and Treasury bonds is the same old deflation trade that pummelled everyone but shorts in 2008.

I view 2008 as a warm-up, a down payment on what is coming in 2010 and beyond. The recovery of 2009 is a fraud, and it will be seen clearly as such a year from now. Obama, Bernanke and Geithner will be thrown to the wolves, and politics will start to get more interesting, with all kinds of radical ideas gaining traction with the public, few of them sensible.

To help prop up the government another war could be started, since the neocons (who never left power but just use a “D” puppet now) would like to destroy more of the middle east. Ugly, ugly stuff, but all too familiar… how does that song go, “all my life, panic in America”?

Ok, let’s look at some charts:

Here is the 5-day average equity put:call ratio. I’m still looking at the summer 2007 period for clues. Remember the flickers of early panic that August, like Cramer’s tantrum? (By the way, my money says that was staged to get public support for inflationary Fed actions at a time when everyone was worried about inflation.)
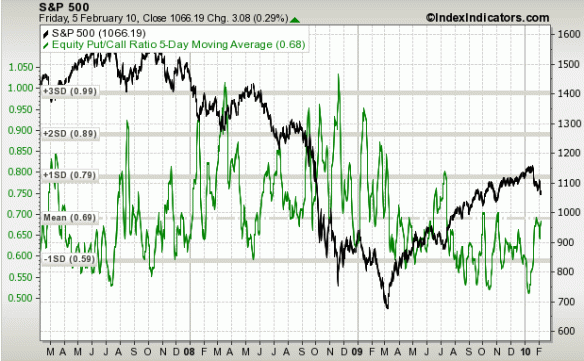
Indexindicators.com

You can see that we’ve still only reached the mean on this powerful fear gauge. It sure feels like panic out there, but only becuase of how serene things have been lately, just like in spring 2007, the Goldilocks era.

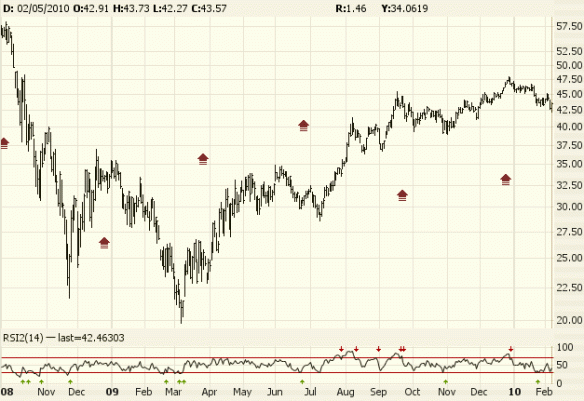
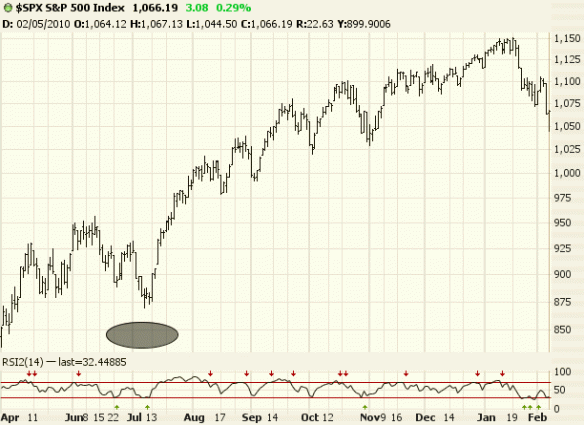
Here’s a daily chart of the last 8 months (I’m also eyeing last summer’s dip for hints, since it was a deflation scare and major sell-off that may offer clues as to some of the dynamics at play):
Prophet.net

Here are some more snapshots of tops, starting with the 2007-2008 b-wave top (the a-wave was 2000-2003, and c is underway — this is Prechter’s labeling, which considers 2000 the start of the bear):
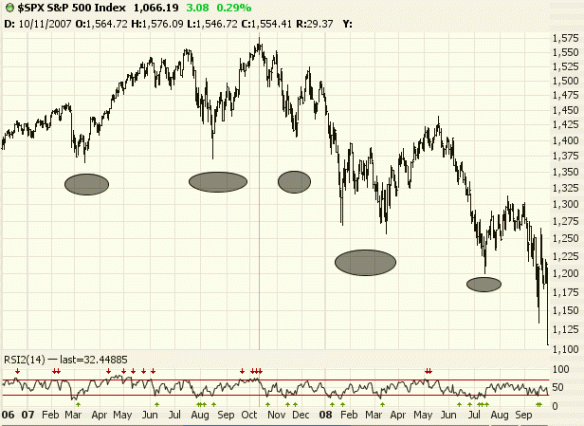
If this move is like the initial drops at the b-wave top, it is mostly over and will be followed by a rally that retraces most if not all of the way back up. There is a difference, though — that was a cycle wave top, and while market complacency has been extreme lately, social mood is nothing like 2007, and the economy is in the toilet. This is the most overvalued market in history (including ’99-’00), and more importantly, it has already taken a wrecking ball to the 2002-2005 technical support. As we saw in the spring of 1930, third waves can move very swiftly through the territory of second waves. Actually, this whole cycle wave c is a third wave on a larger scale, and it only took 12 months to retrace the entire 4.5 year rally from spring 2003. The start of a smaller scale 3rd wave can been seen above in the decline from the May 2008 peak: unrelenting. (Much of this labeling of higher degree waves has emerged as a kind of consensus among wavers, including Prechter’s EWI, MishDaneric and Mole.)

Here is the top of the bear market rally that lasted from Nov 1929 –  April 1930:
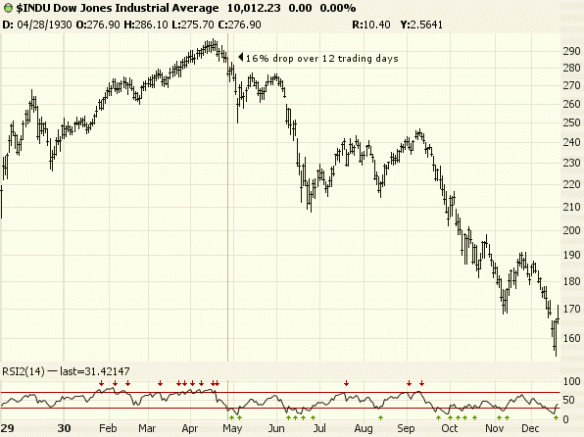
That drop started off with more intensity than this one, as the Dow has fallen just 8.3% intraday in 13 trading days, compared to 16% in 12 days. It is of course possible that we catch up very quickly with a minor crash, akin to the gap down and 6.4% intraday drop on May 5th 1930. Prior to that the market was down 11% intraday. Note how the market crashed from allready oversold conditions, as it usually does. Such a washout also happened on August 16, 2007. A 5% intraday loss this Monday or Tuesday would be one way to resolve the still mild VIX, put:call and DSI readings. If such a crash does occur, it would be a good time to buy in anticipation of a very sharp snap-back. It is probably too early for a sustained crash (Oct ’29, Oct ’87, Oct ’08), but of course in ’87 the market went from oversold to very oversold to the greatest intraday drop of all time. It did not, however, do that right from the top without putting in a first and second wave:
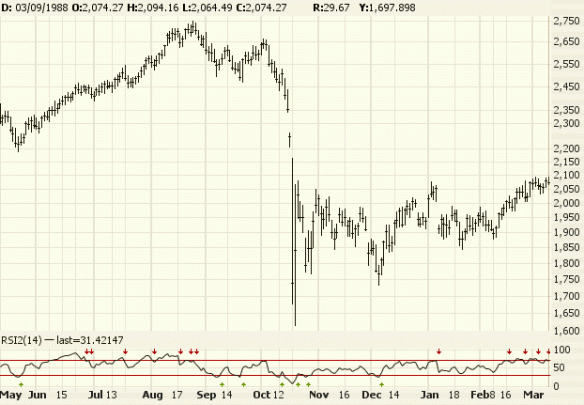
Now that’s why you need stop-losses (and another reason why futures are best since you get stopped out overnight and not at the open by which time the market could be down 8%).

One more big top for your consideration, 1937: the first wave down was composed of a series of ones and twos — 5% declines, 3% gains, rinsed and repeated:
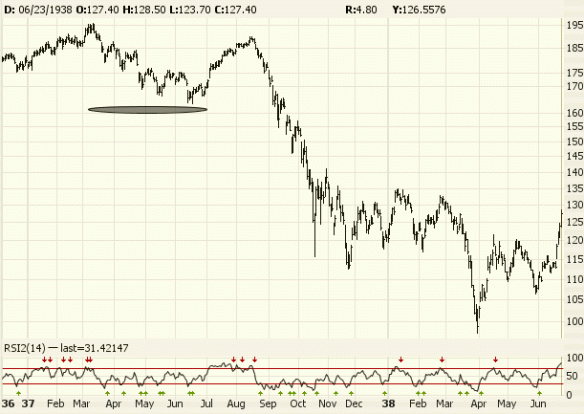
(That’s right, the market crashed again after FDR’s policies hamstrung the economy and pushed the US deeper into the depresssion. The market fell lower still in 1942 as the war and inflation crushed private enterprise.)

I’m also keeping an eye on the finacials and REITs, which would both look better if they dropped a bit more before a bounce. There just isn’t that much so far to react against. The financials (XLF):
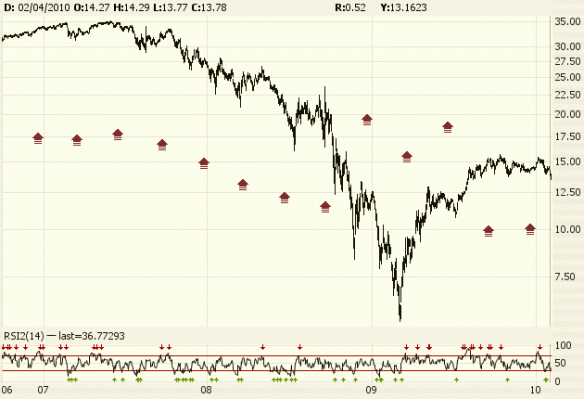
The REITs (IYR):

I don’t see much panic at all in these groups, though they are clearly rolling over. They could stall for a while, but It is hard to see a big bounce here, and without the financial sector the rest of the market isn’t going to get far.

In sum, my best guess is that this will play out like either (1) July-August 2007: chop for the next week or two — big swings, maybe a new low — then some kind of rally for 2-6 weeks (though I don’t think we’ll get a new high — my target would be 1075-1115); or (2) May-June 2008, with a steady drift down. But for 2010, it’s just down, down, down.

Credit markets iced over. Put your head between your knees.

This is still a Goldilocks economy?

Many standard fear gauges remain near their most elevated levels of the bust so far. From highly emotional conditions like these, we should expect a big move in equity prices. The question is whether the next emotion is relief or all-out panic.

If the fundamentals were not so horrible and stock prices not so high (with earnings falling off a cliff, real PEs are in the stratosphere and dividend yields are pathetic), this would be a promising time to go long, at least for a trade. As is, that would be Russian Roulette, because it would be hard to imagine a market more primed to absolutely crash than this one.

With open talk of a depression from the Secretary of the Treasury, and the President comparing the financial system to a “house of cards,” the Dow Jones Industrial Average registers the same opinion about the economy as it did in mid-2006, when talk of Goldilocks was in the air. Something has to give.

This is the Dow from summer 1982 to the present. We are still at the crest of the tidal wave:

Click image for larger view. Source: Yahoo! Finance.

Last week (Sept 15th-19th) a huge amount of steam was let out out of the market, first from the bears, and then from the bulls. By Friday afternoon, traders expressed physical and emotional exhaustion, and volume dried up. It was an eerie feeling.

That week started off in a fright, with new lows on the Dow, T-bills under 0.1% and a VIX over 40. In a lesser bear market, Thursday’s bailout announcement should have marked a substantial bottom (by no means the bottom, but at least the basis for a tradeable rally).

However, the 1000 point, three-hour rally from 2:30PM on Thursday to 11:00AM on Friday hardly set up the basis for a sustained rise, since where else could stocks go but down after such a move? The very violence of it showed how much fear was out there by Thursday morning. We were truly looking into the abyss, that netherworld below 10,000.

After the short-squeeze ran out of steam, prices dribbled down from Friday afternoon to this Wednesday on low volume and volatility, before a little follow-up rally Thursday and Friday relieved the very-near-term oversold condition.  The Dow rests this weekend at 11,143, awaiting what will surely be a wise edict from the philosophers in our legislature. 11,143 is a number neither too ugly sounding nor too pollyannaish, square in the middle, with plenty of room on either side (at least for the near-term).

10-day view here (double lines mark the days):

Click image for larger view. Source: Bigcharts.com

Fear is still highly elevated, no doubt stoked among the general public by the scare tactics and demeanor of Messrs. Bernanke and Paulson. Over the last week, even people who did not support Ron Paul for president have begun to acknowledge the magnitude of the problem. The question is, what are they going to to about it, and when?

To see where Mr. Market’s next move is coming from, follow his rates, not his stocks.

The credit market isn’t waiting for anyone, public nor Paulson. As far as banks are concerned, it’s already TEOTWAWKI, and that is important because changes in credit markets precede changes in equity markets. Two summers ago, while Goldilocks was still enjoying her porridge, bond traders were looking out the window and deciding to pay a premium for long-term debt over short-term (an inverted yield curve is almost always followed 12-18 months later by a recession).

Short-term Treasury yields of course are extremely compressed. 3-month T-bill yield here:

Click image for larger view. Source: Yahoo! Finance

Here is the TED spread, the difference between LIBOR (the rate that banks outside the US Fed system lend one another overnight) and 90 day Treasuries. A wide spread indicates reluctance to lend, i.e., a lack of trust between banks.

Click image for larger view. Source: Bloomberg

Here’s another scary picture from the credit markets, the discount rate spread, the difference in yield between AA and A2/P2 rated commercial paper (short-term corporate debt such as trade receivables). This is why non-Treasury money market funds are so risky (and why Paulson wants to bail them out):

Click image for larger view. Source: Federal Reserve

Fear bloodhounds should also be trained on the Chicago Board of Exchange Volatility Index, a measure of expected volatility in the S&P 500, as indicated by near-term options prices. From summer 2006 to summer 2007, the VIX dipped under 10 at times, truly the calm before the storm, registering the very apex of the decades of unfounded optimism and imprudence that brought about this mess. During the dot-com bust, it nudged over 40 on occasion, a number that was breached intraday in the pre-bailout depths of last Thursday. Two-year view here:

Click image for larger view. Source: Yahoo! Finance

This bear is scared to hell of Goldilocks. It’s too dangerous out there to even short with the confidence that you can get paid if you are right. Where will the money come from?

Please see disclaimer.