Technical update: overbought, overbullish, declining RSI

We finally have the classic syndrome that indicates an intermediate-term top. Upward momentum has stalled, as sentiment has remained elevated for several weeks. The combination of sideways prices on high bullish readings becomes very bearish when it has been sustained for a month or longer.

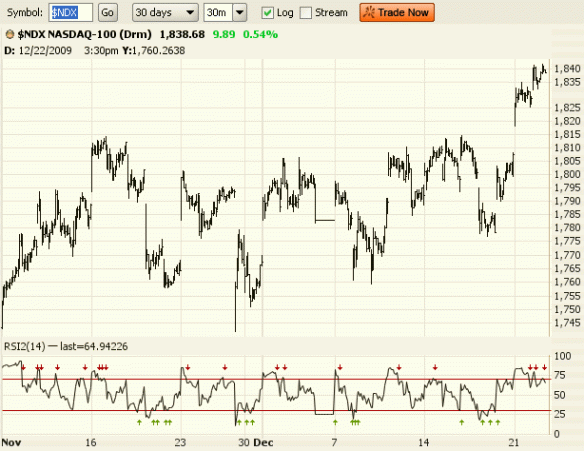
Here is the RSI and price picture (note declining trend in the momemtum indicator RSI since late August, and its resemblance to the topping pattern last spring):

SPX and RSI

NDX and RSI
Charts from Yahoo

A quick glance at sentiment shows sustained optimism:
NAAIM
Source: http://www.naaim.org/naaimadsenttrend.aspx

Looking at the headlines, it is nice to see good news that results in a bump with no follow-through. We saw that in mid-September with QE Infinity, and last Friday with the jobs report. Rallies end on good news and declines end on bad news.

It would not be unusual to see another test of the highs, and for prices to linger at these elevated levels for another month or so, but the odds of a sharp decline are now elevated, and any further gains should be quickly erased.

Long term Russell and Nasdaq charts

These two have the furthest to fall, and are really still in the process of making an historic secular bull market top.

The Russell looks like it’s forming a giant head and shoulders:

Prophet.net

See those RSI trends on the bottom? This is a market that’s running out of steam. We know from mutual fund reports that managers are already “all in” again as of January, and as Richard Russell says, it takes buying to put stocks up, but they can fall under their own weight.

And the NASDAQ 100 is back at 1999 or 2007 levels! These indexes, like Chinese and Indian stocks, show that the world still has an astounding appetite for risk in the face of depressionary business conditions. It was one thing to pay 100 times earnings when the credit expansion was still going and almost nobody knew how the story ended, but now that it is plainly over, what are people thinking?

Russell 2000 yield: 1.2%

Nasdaq 100 yield: 0.49%

Stocks in the Nasdaq 100 with zero dividends:
z
Adobe Systems
Amazon
Amgen
Apollo Group
Apple
Autodesk
Baidu
Bed Bath & Beyond
Biogen Idec
BMC Software
Celgene
Cephalon
Cerner
Check Point Software
Cisco Systems
Citrix Systems
Cognizant Technology
Dell
DirecTV Group
Dish Network
eBay
Electronic Arts
Express Scripts
First Solar
Fiserv
Flextronics International
FLIR Systems
Foster Wheeler
Genzyme
Gilead Sciences
Google
Henry Schein
Hologic
Illumina
Intuit
Intuitive Surgical
Lam Research
Liberty Interactive Series A
Life Technologies
Logitech International
Marvell Technology
Mylan
NetApp
NII Holdings
NVIDIA
O’Reilly Automotive
Patterson Companies
Priceline
Qiagen
Research In Motion
SanDisk
Seagate Technology
Sears Holdings
Starbucks
Stericycle
Symantec
Urban Outfitters
Verisign
Vertex Pharmaceuticals
Warner Chilcott
Yahoo
a
After the last year’s action, it should be abundantly clear that fundamentals do not drive stocks, and they only offer resistance and support at the most extreme heights and bottoms. Herding behavior, animal spirits, fear and greed are what make the tickers tick.
a
That said, we are now entering a long phase of value restoration. By the end, people will talk about steady cash flow and yield again, as they did in 1982 and 1942. It will take a lot more than the above to lure them in, and since there are no more miracle cures for the numerator in the yield equation, the denominator will have to come down to earth.

Nasdaq at major resistance

Look at how important this level is for the Nasdaq 100 .  It has been both resistance and support and seen breakaways and breakdowns. It also happens to be the 61.8% Fibonnacci retracement of the ’07-’09 decline.

Source: Prophet.net

Levels like this are not voodoo. When there has been a lot of activity at a certain price, there is much emotional weight attached to it. In this case, those who went long the Nasdaq and its components at this price must be delighted to be breaking even here. Those who decide to count their blessings and sell provide supply, as do the other longs and short sellers who recognise the importance of the level. If there is more eagerness from buyers than sellers here, that supply will be absorbed and prices can move higher, as people get more confident that the bear market levels are behind us. Of course you could say that for any level, but levels that have previously lead to multiple reversals or accelerations have extra importance.

A breakthrough here will mean a lot more if the S&P500 and Dow follow suit. As noted before, in ’07 and ’08 the NDX had a habit of coasting higher just as things deteriorated. The Dow and SPX of course are still under their highs so far.

Shorting the Nasdaq and Russell 2000

Both are overbought on flagging momentum. Note the high and downsloping RSI (Relative Strength Index) since yesterday:

Source: Prophet.net

I’ve been playing around with Tim Knight’s creation, Prophet Charts, and I have to hand it to him — this is the best assembly of technical analysis tools that I’ve seen.  Stockcharts.com is still pretty good for a free service, though (I haven’t tried their subscription tools).

Also of note today is that the VIX has broken 20. Options are cheaper than at any point since the Summer of ’08. The lofty equity valuations, flagging momentum and sense of complacency remind me of the Goldilocks winter and spring of ’07, when prices drifted upward slowly in a narrow channel before suddenly cracking, first with a 400 pt decline in the Dow on one late February day, then with the seizing of the credit markets in late July.